LanGuages of Motion
Data Vizualization, Motion Graphics
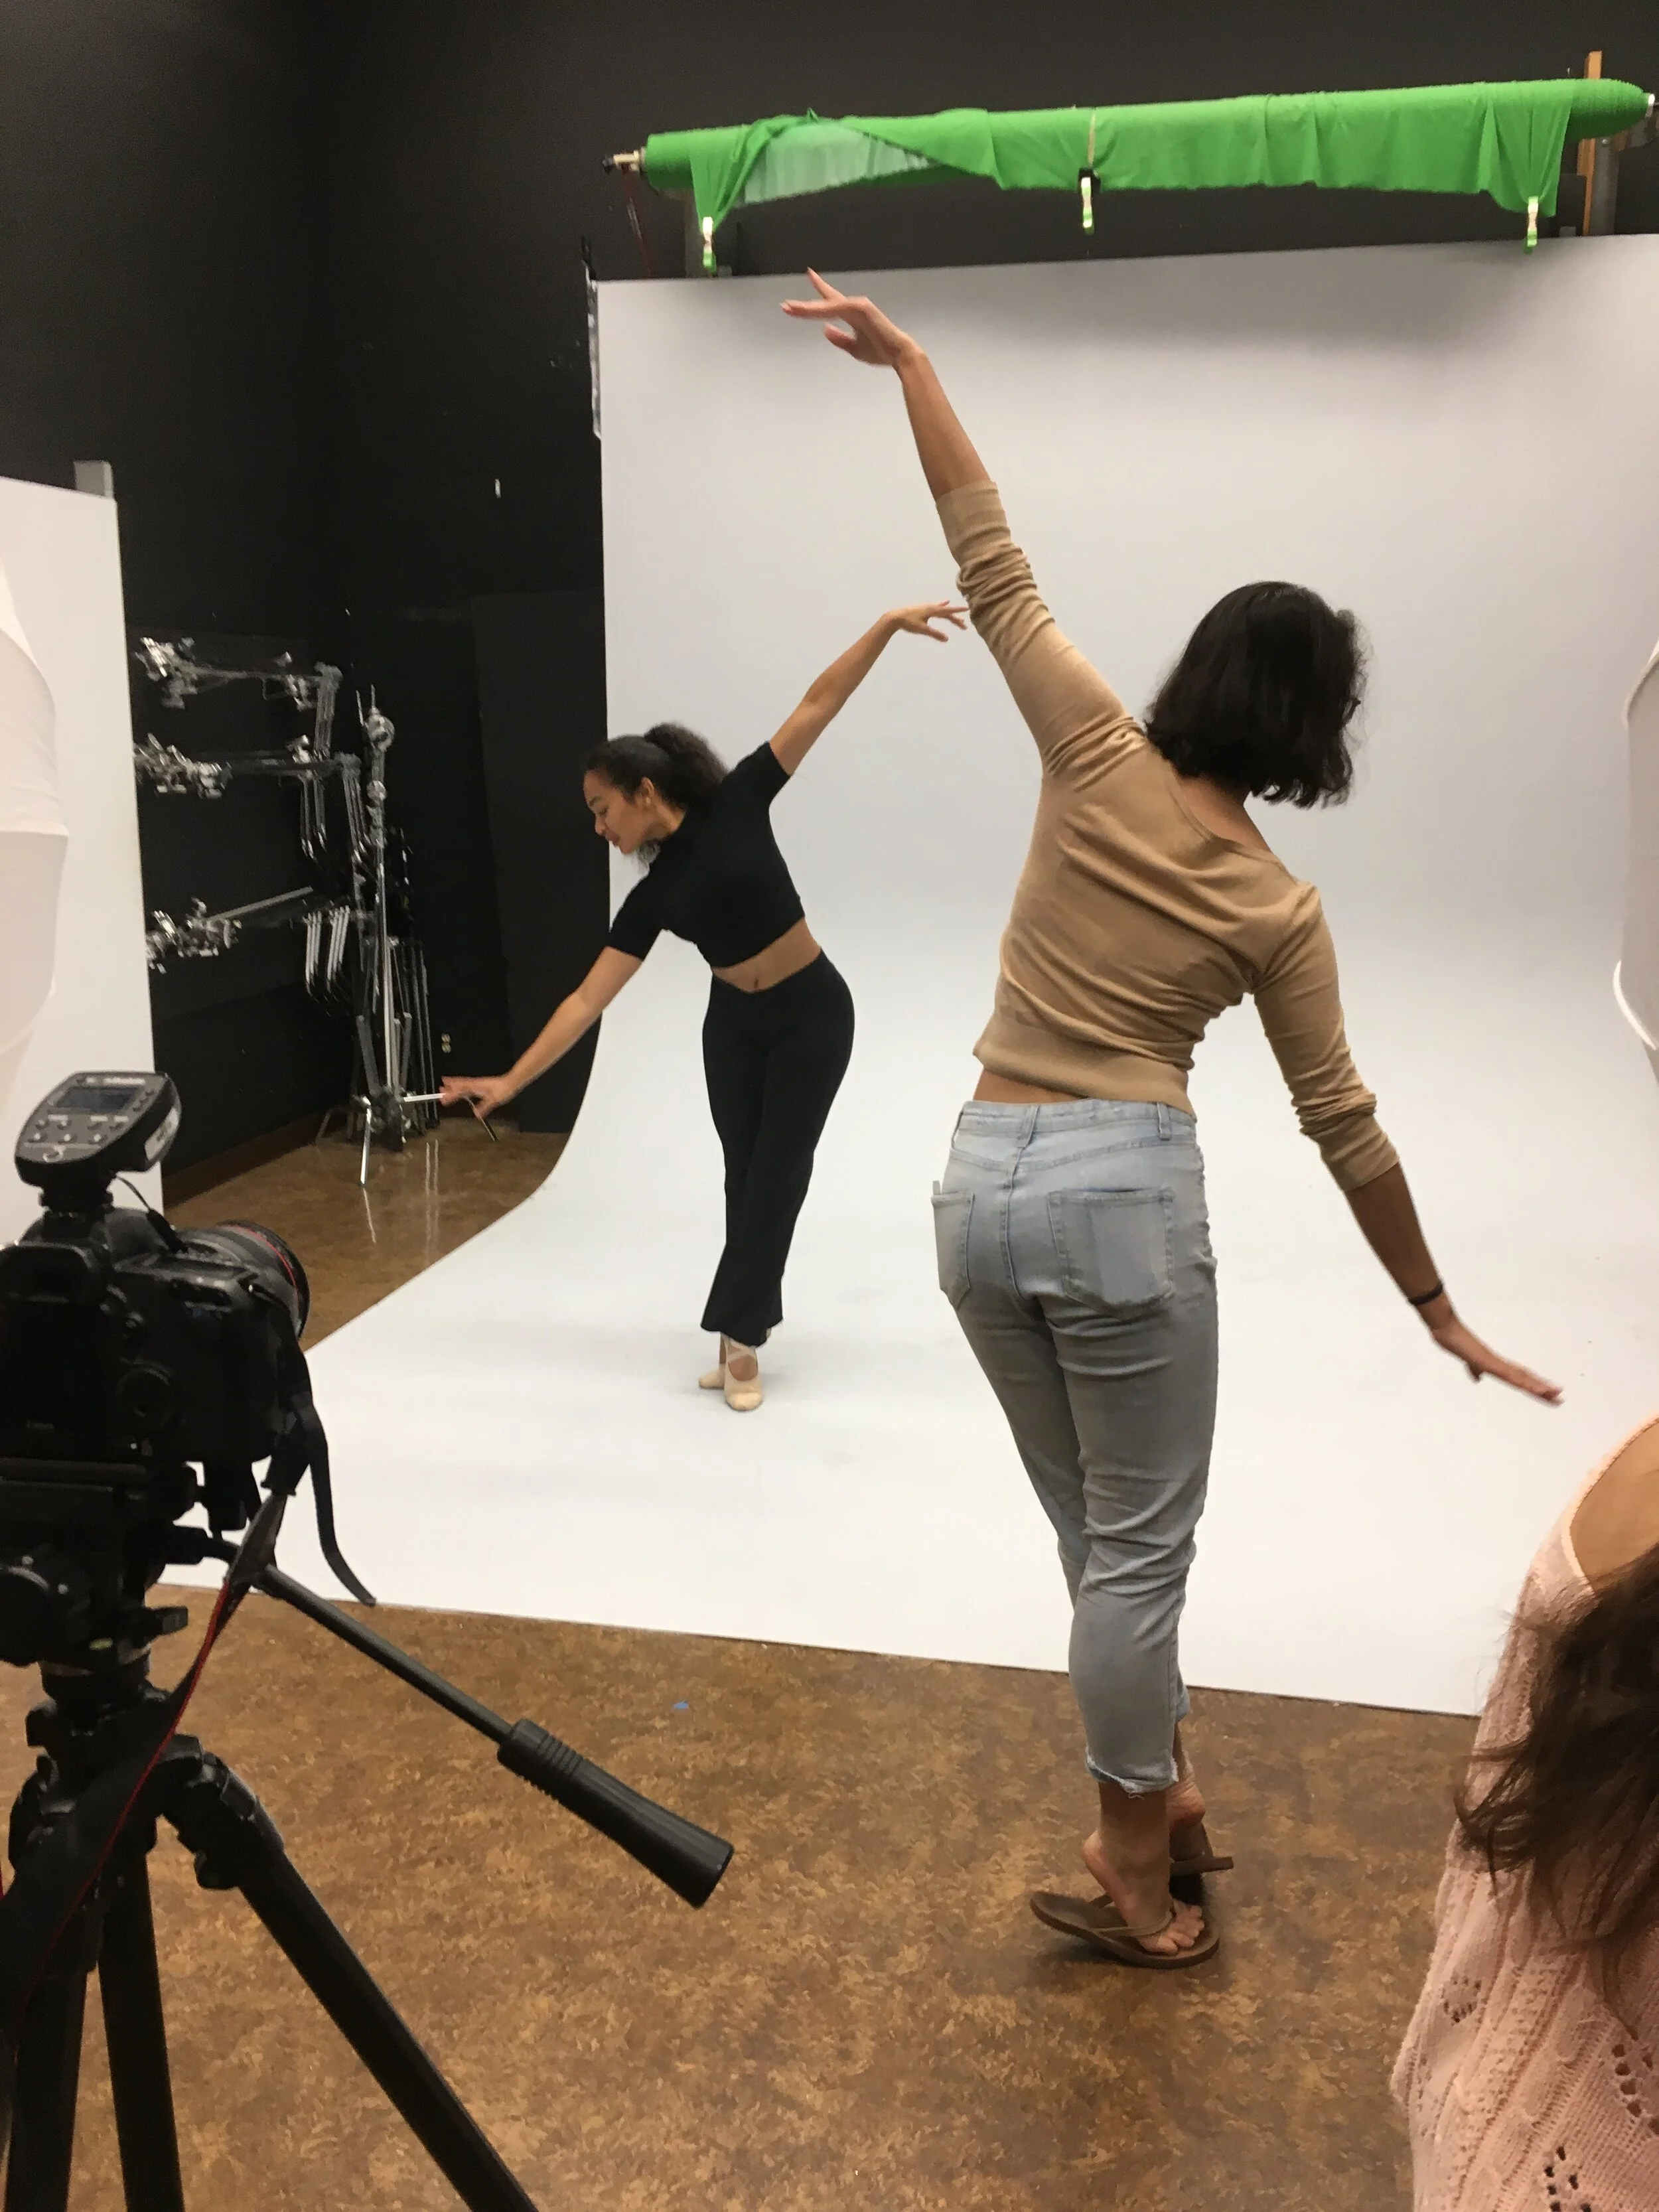
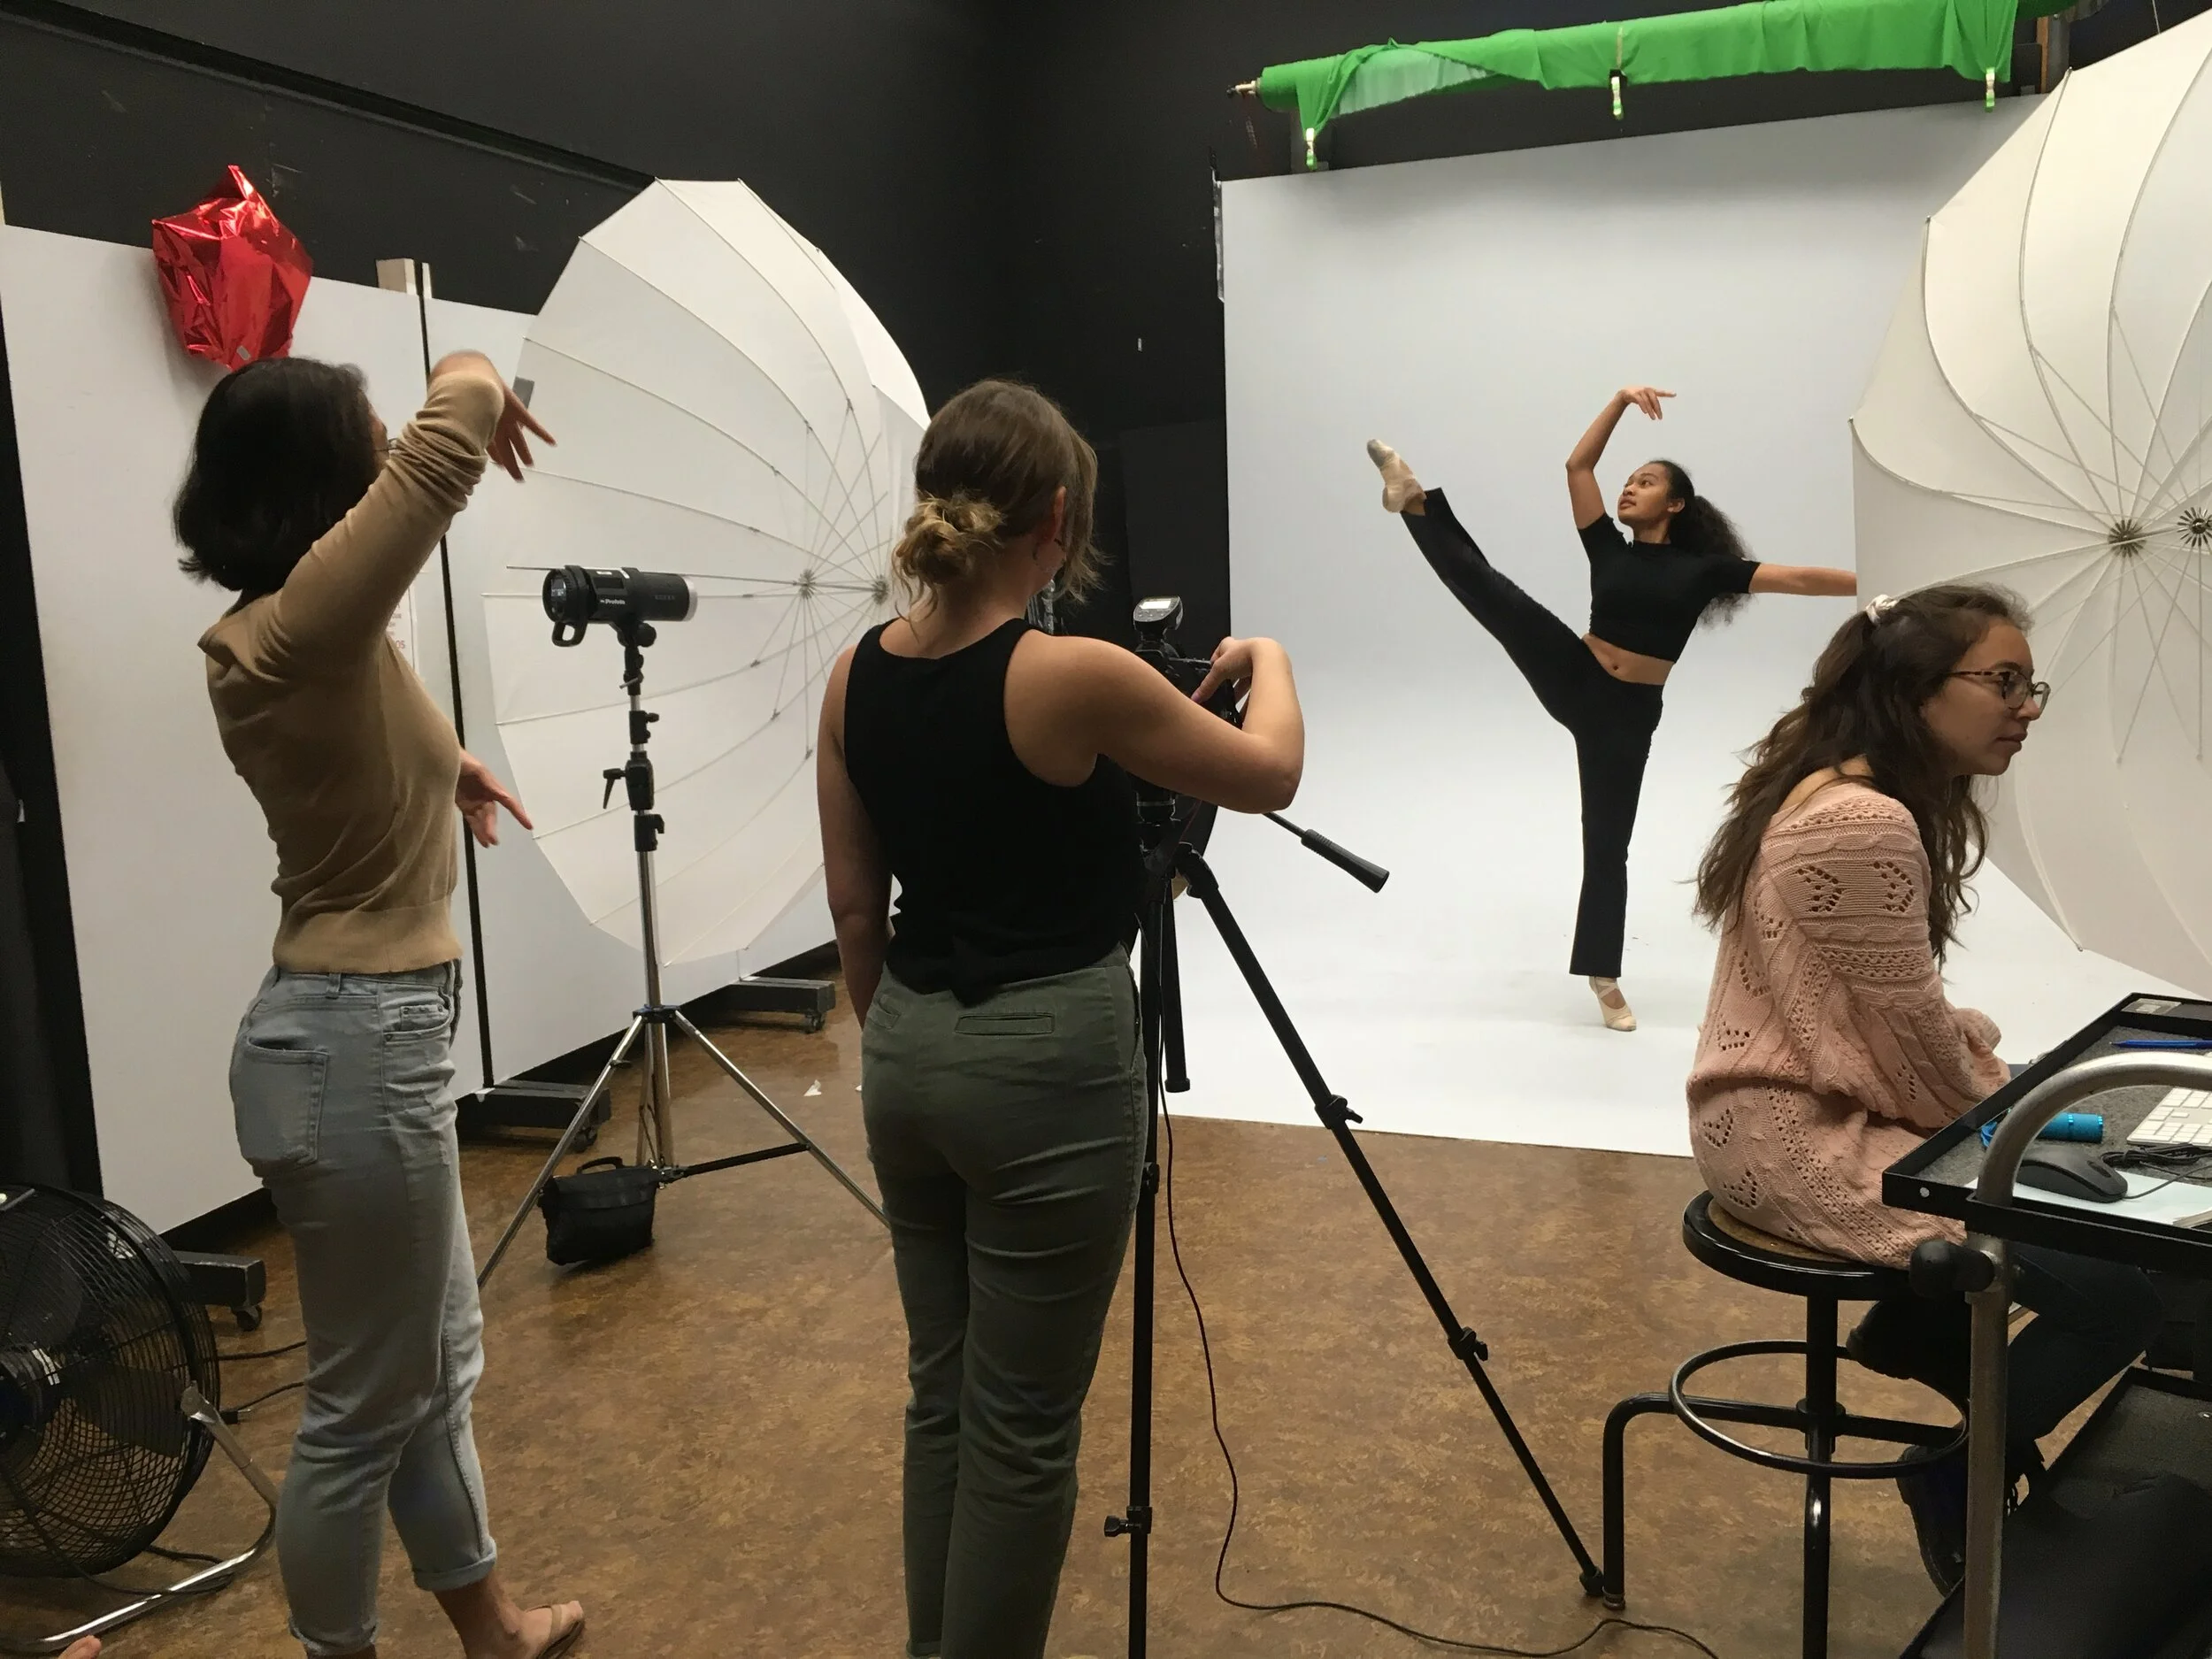
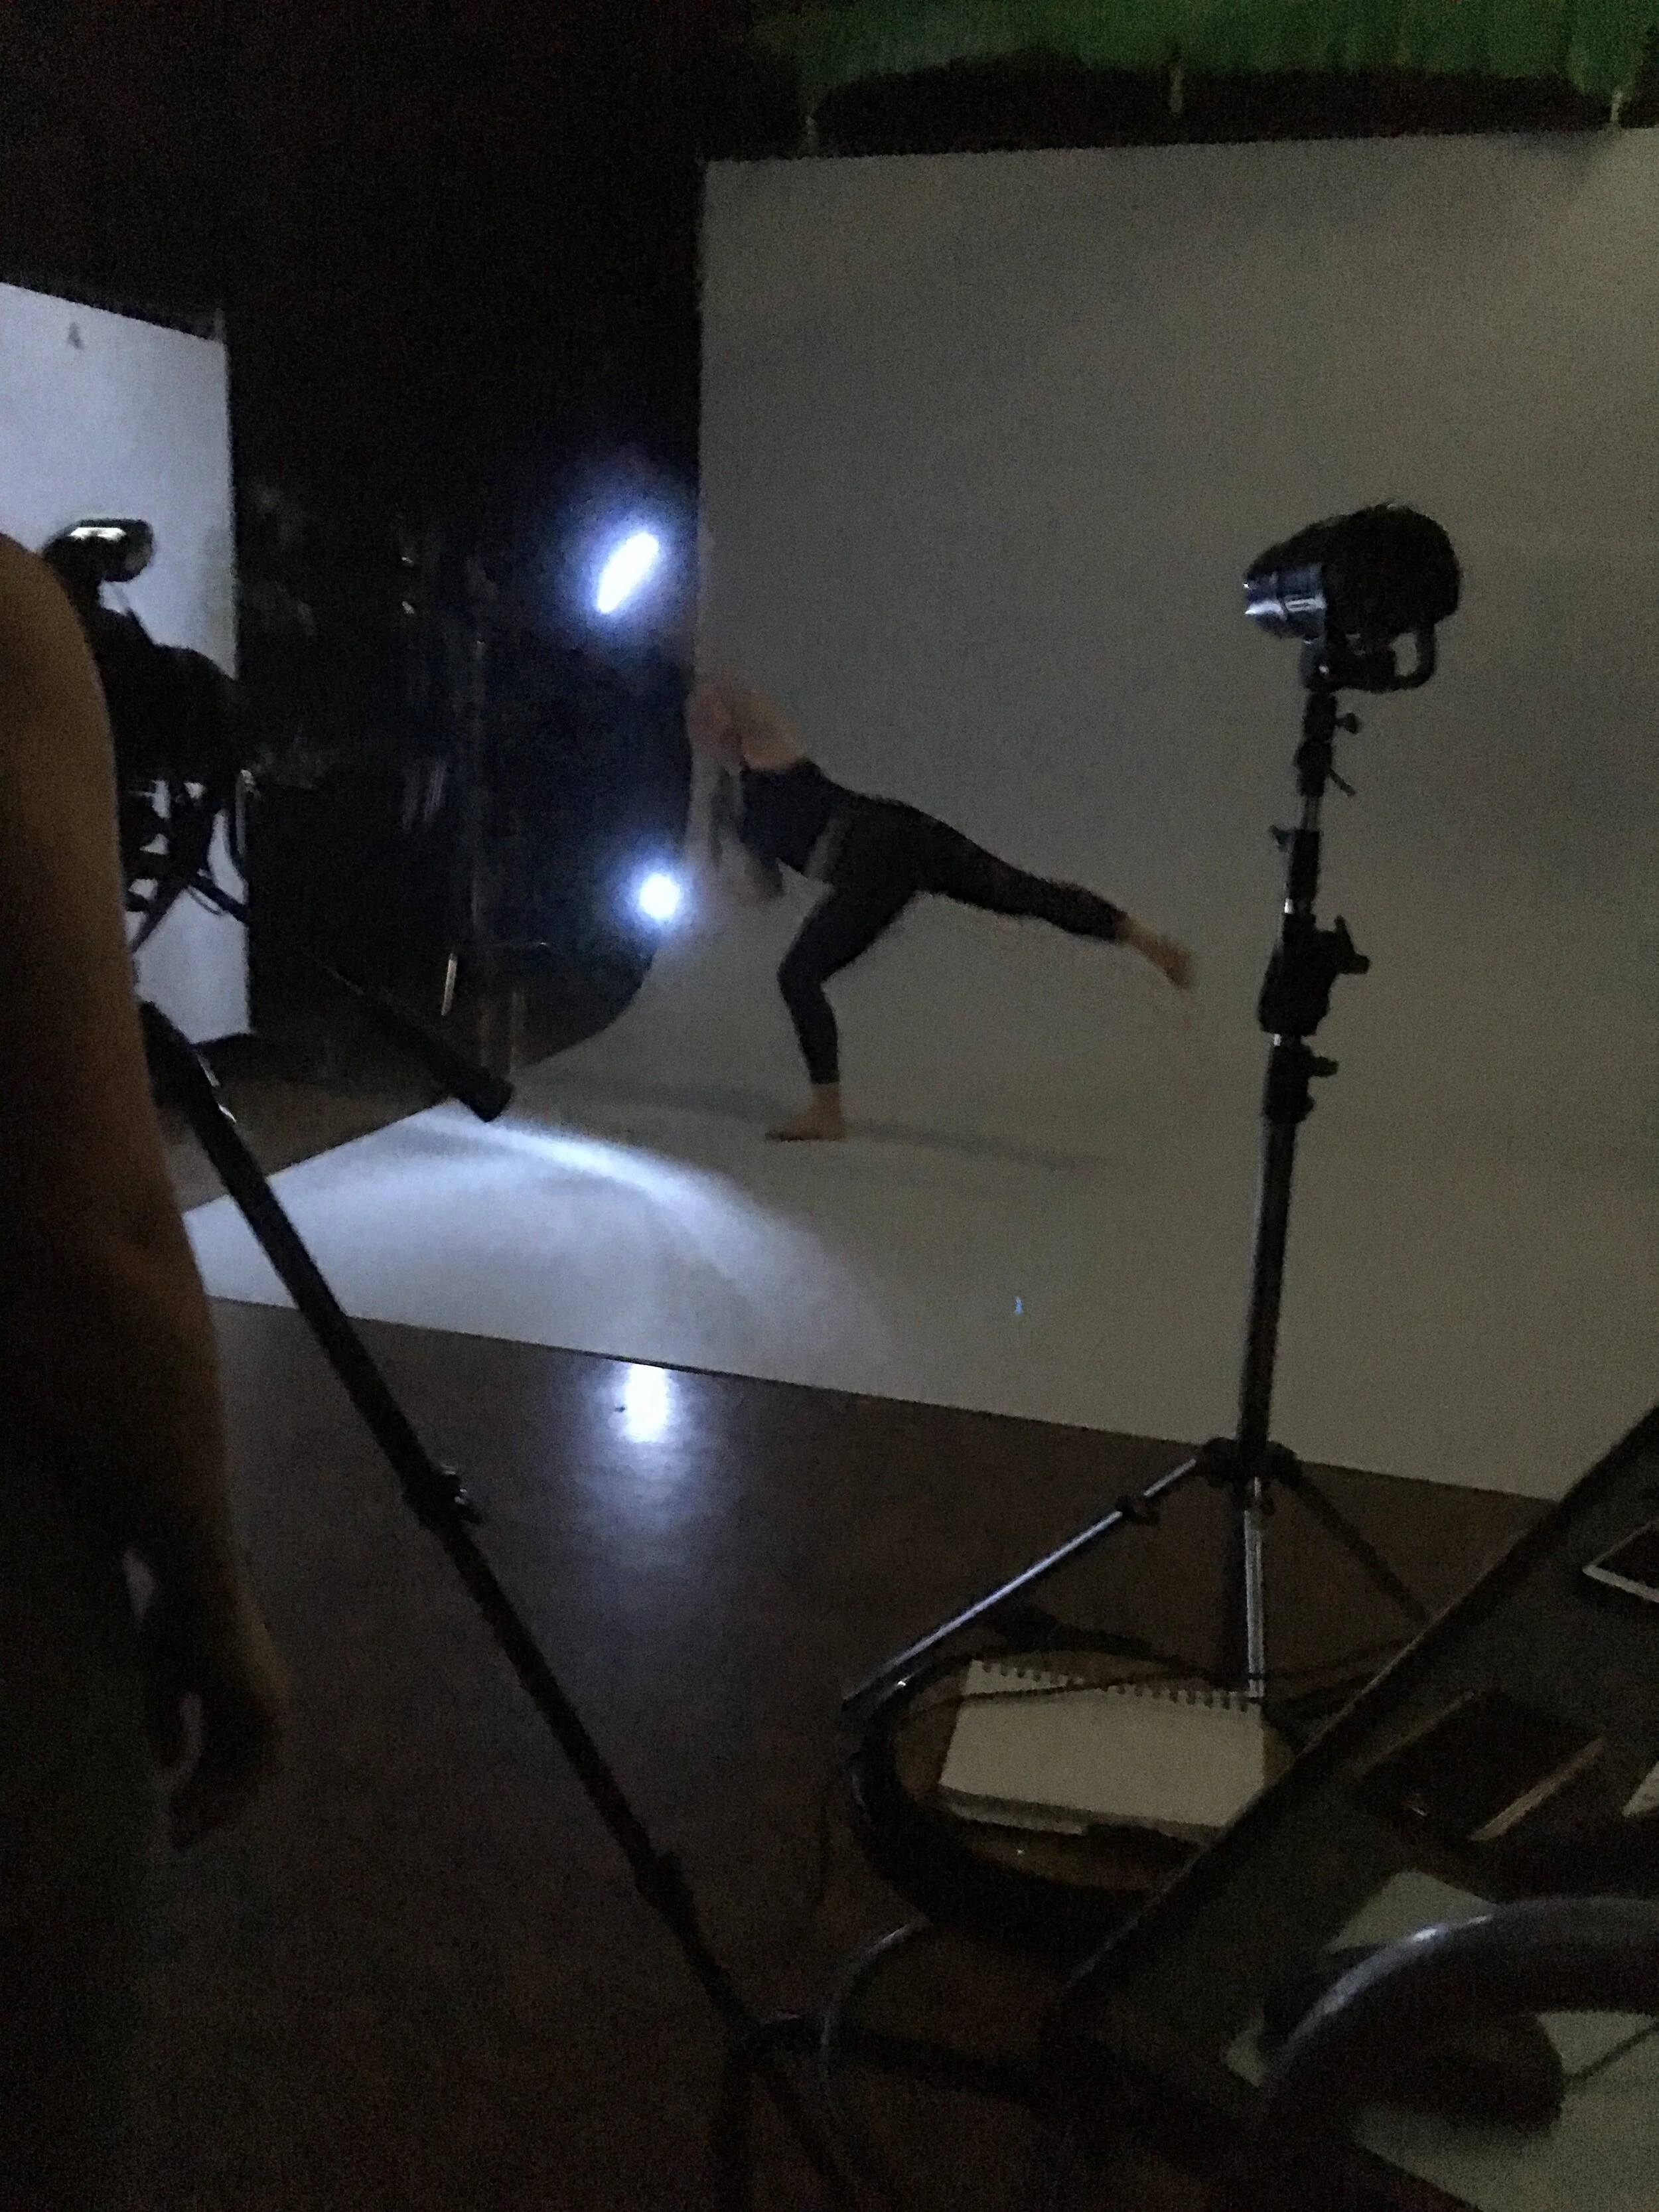
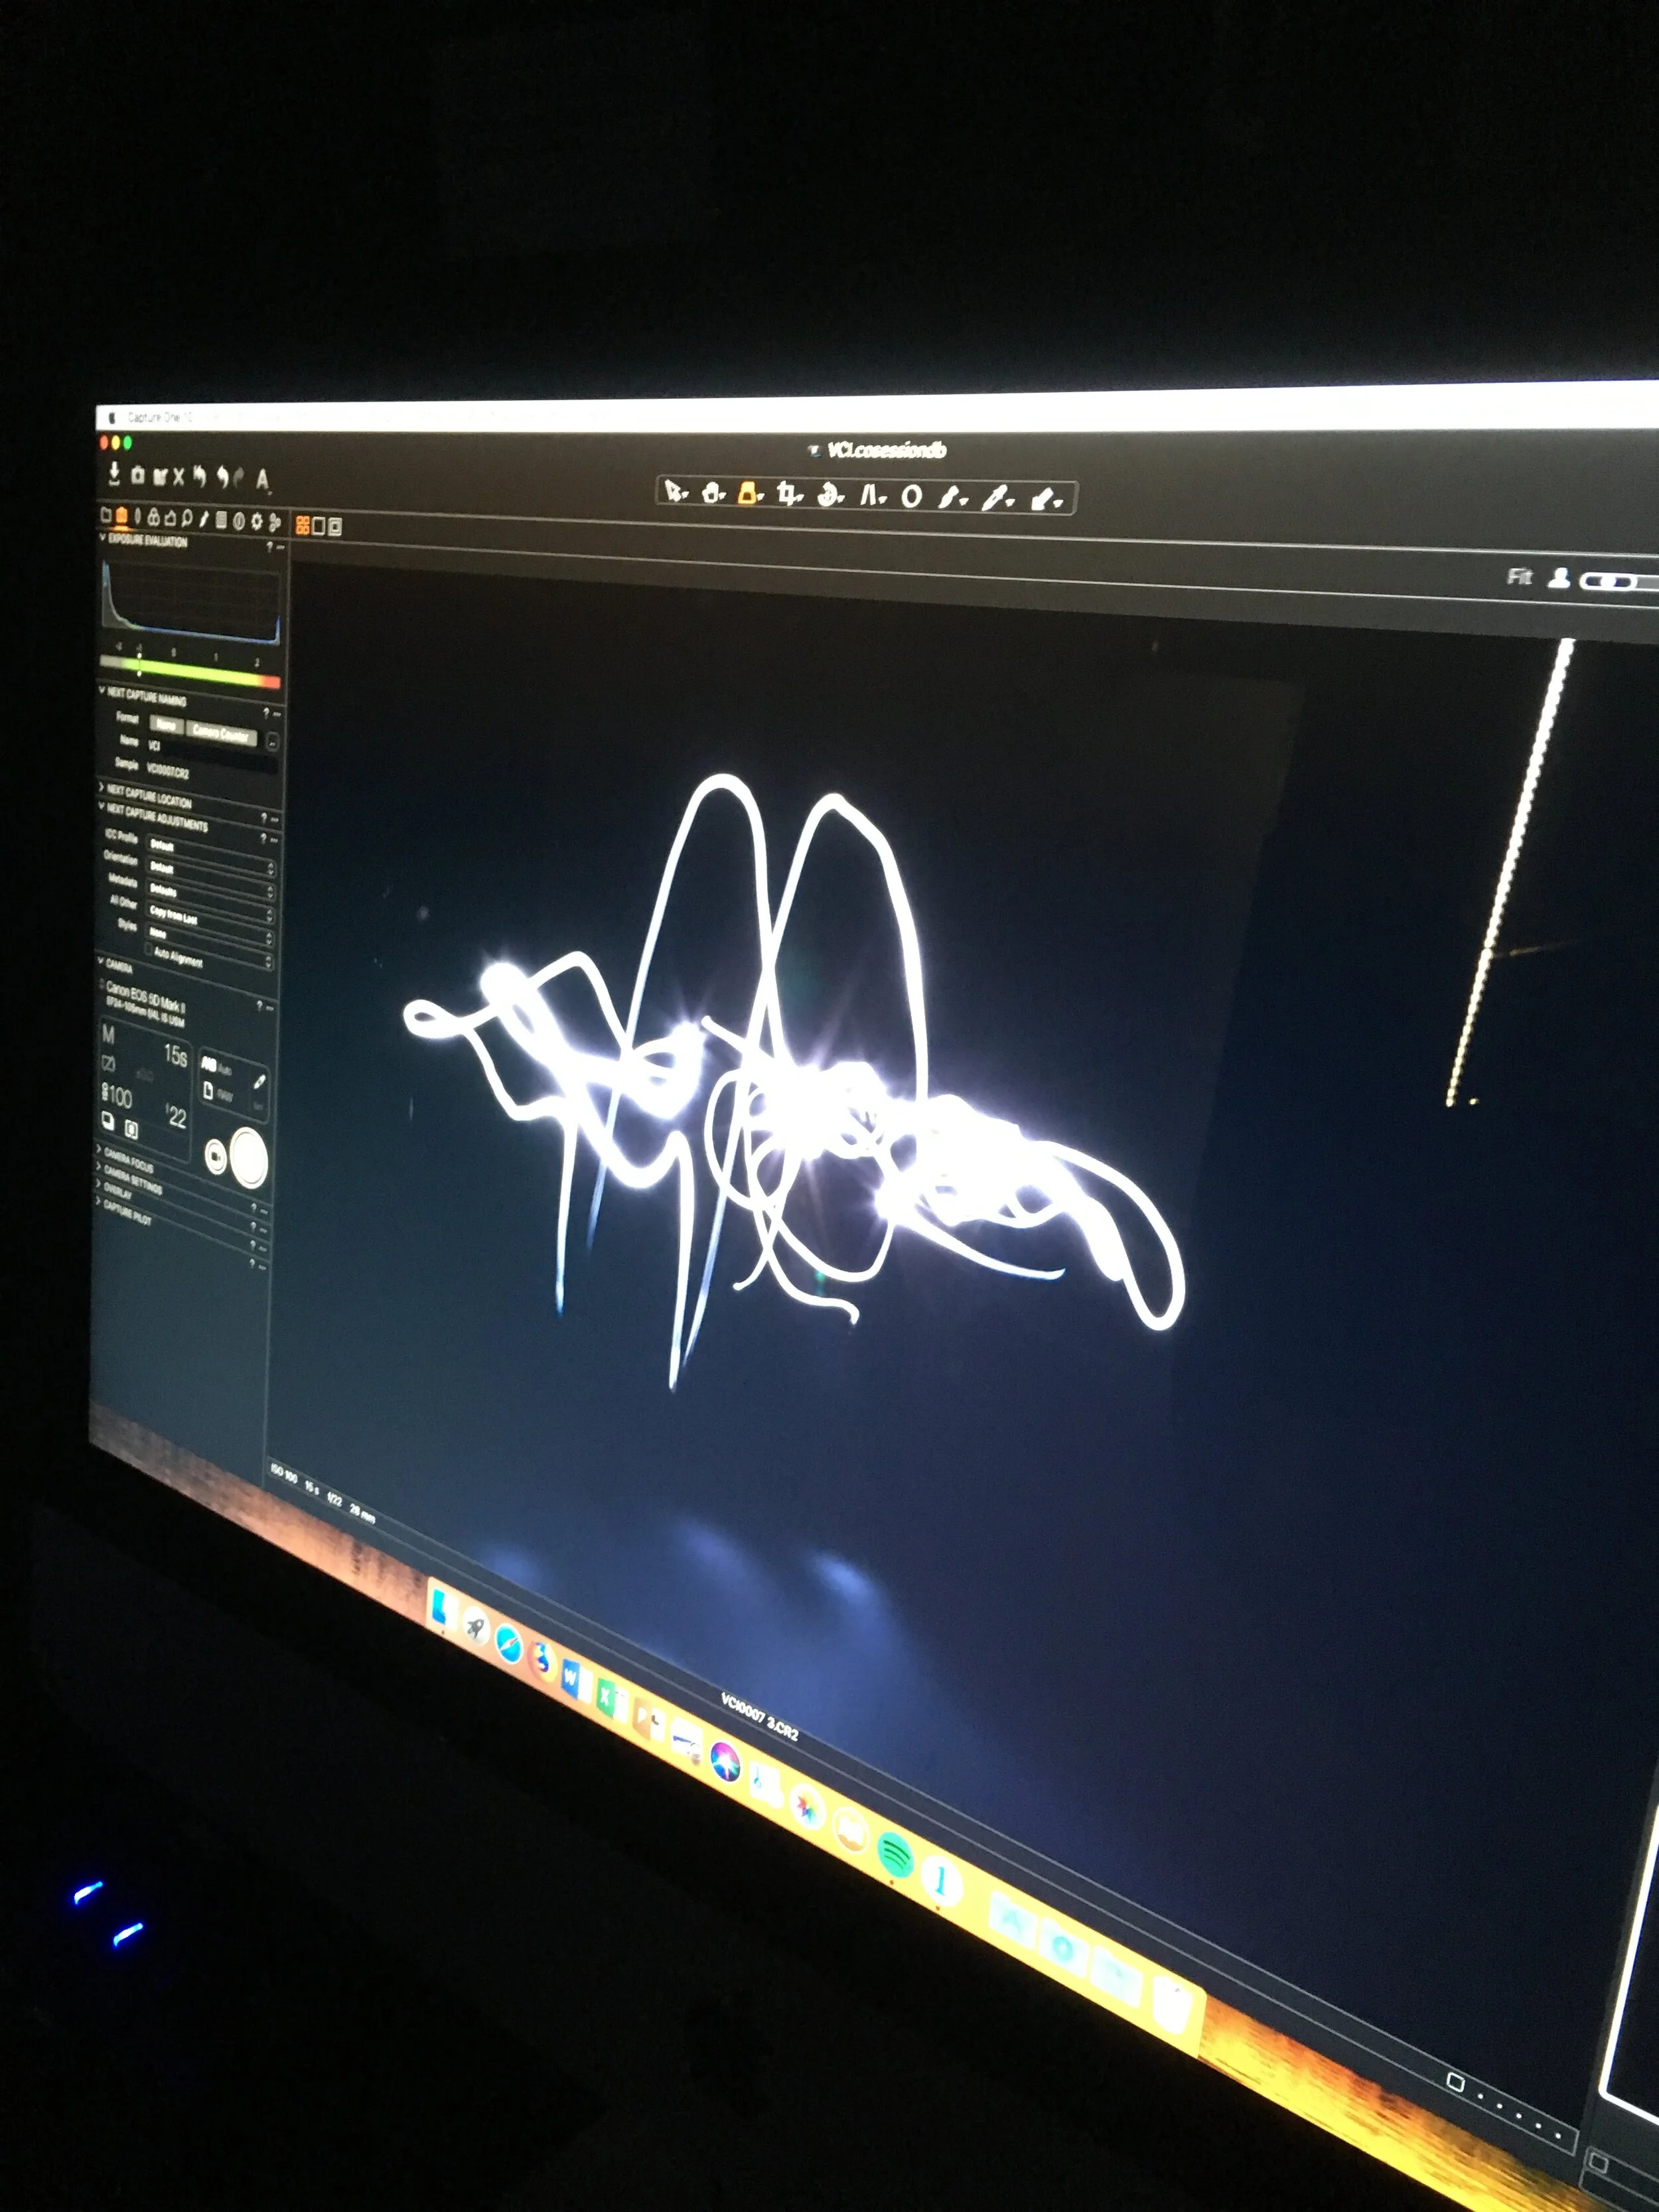
I collaborated with a photographer and one of the student curators to create this supplementary data visualization for “Impact: The Visual Communication of Information”. We experimented with photographic and animation techniques to reveal the geometric shapes within arcs of movement.
Be clear, be confident and don’t overthink it. The beauty of your story is that it’s going to continue to evolve and your site can evolve with it. Your goal should be to make it feel right for right now. Later will take care of itself. It always does.
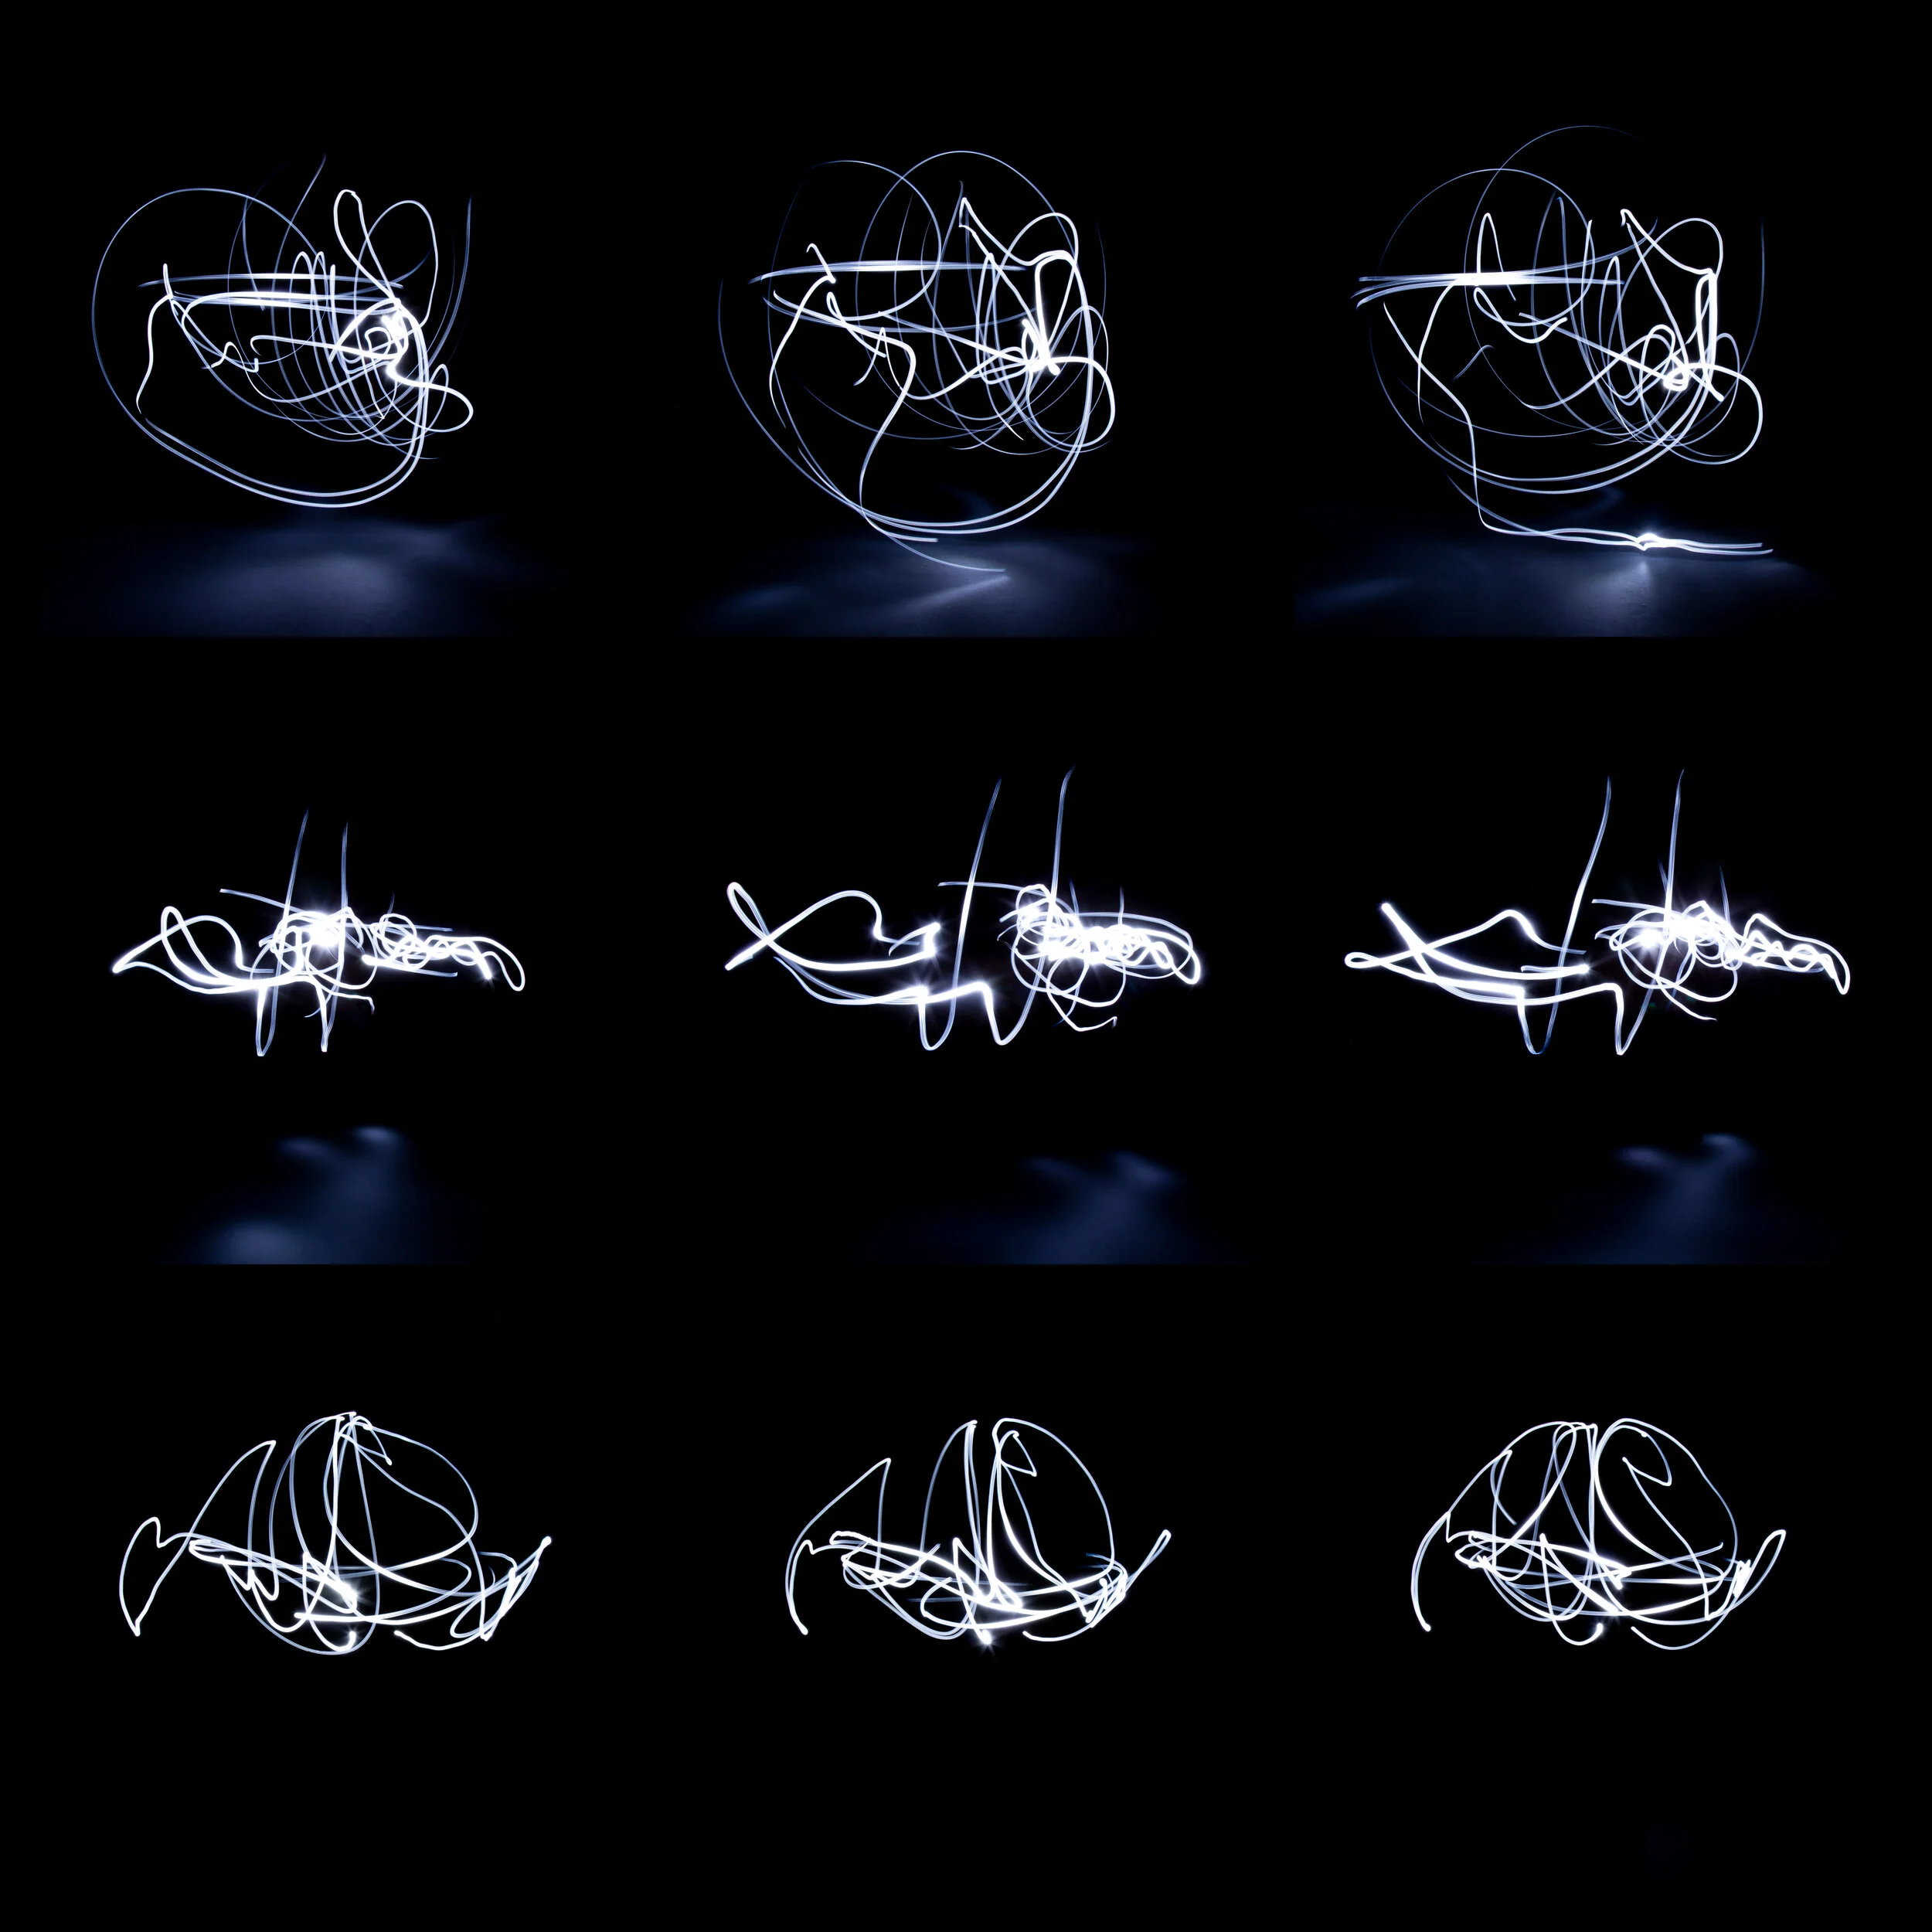
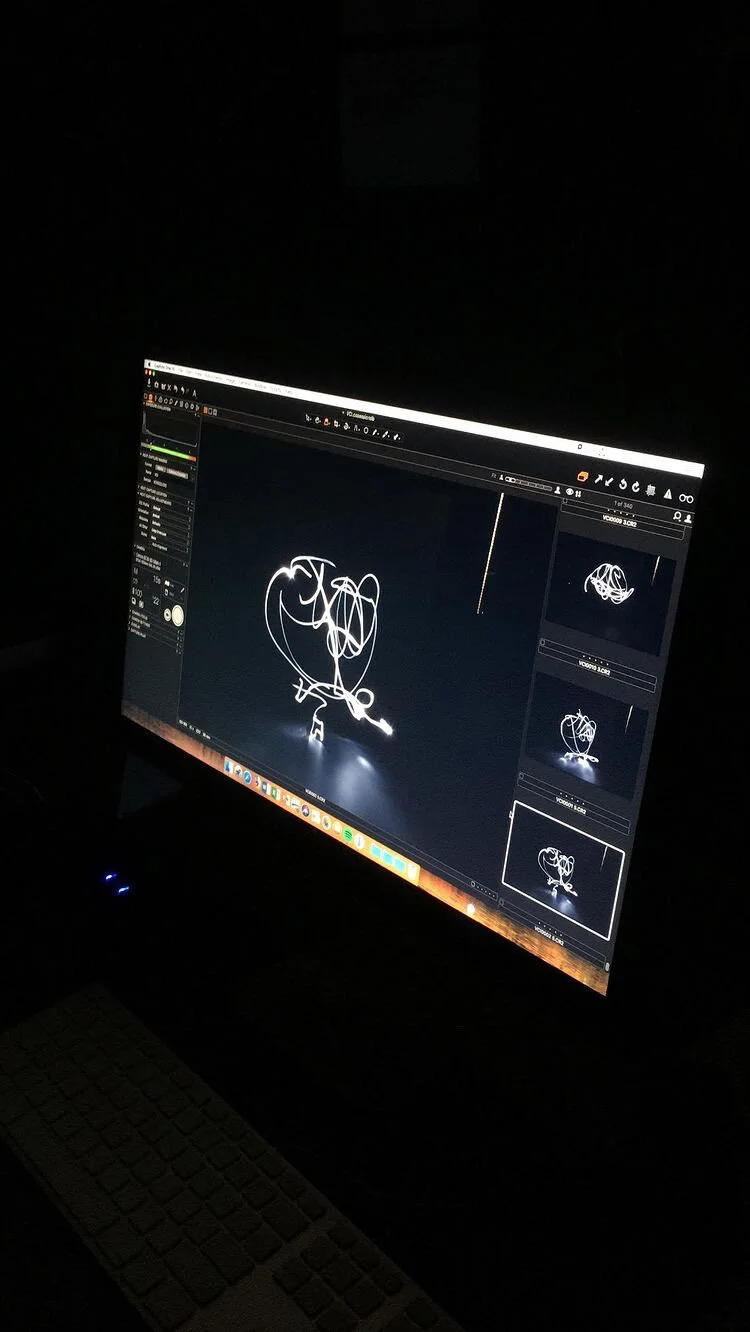
With the help of long-exposure, the variation within styles of dance (from top to bottom: modern, contemporary, and ballet) are revealed. We can even see differences between the dancer’s repetition of the same dance.
I mapping the shifting distance between points on the body to track them throughout the three dances. The graceful expressive motion of a ballerina’s arm can be reduced to fluctuating relationships between two points.
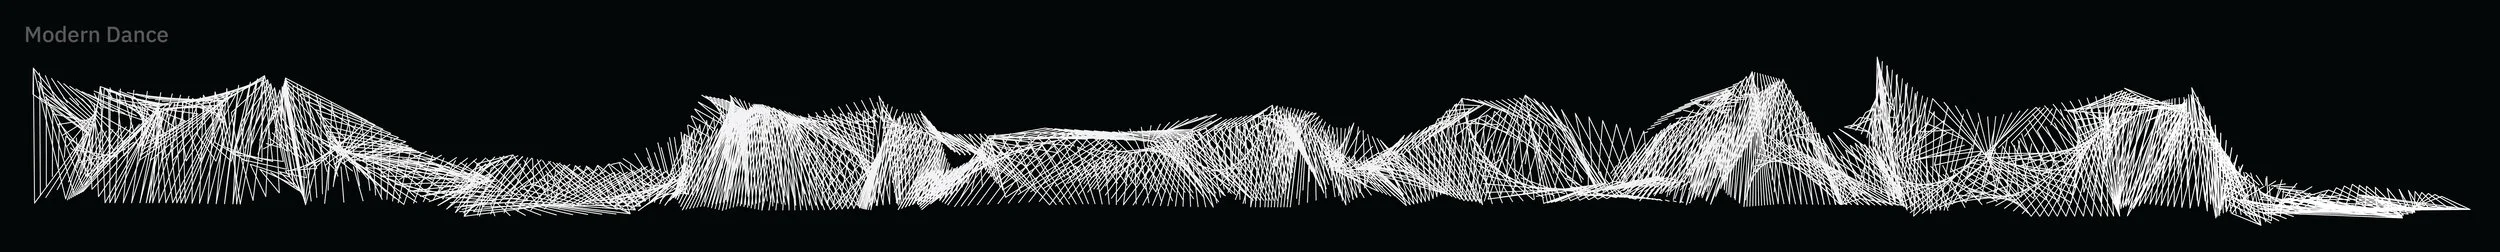
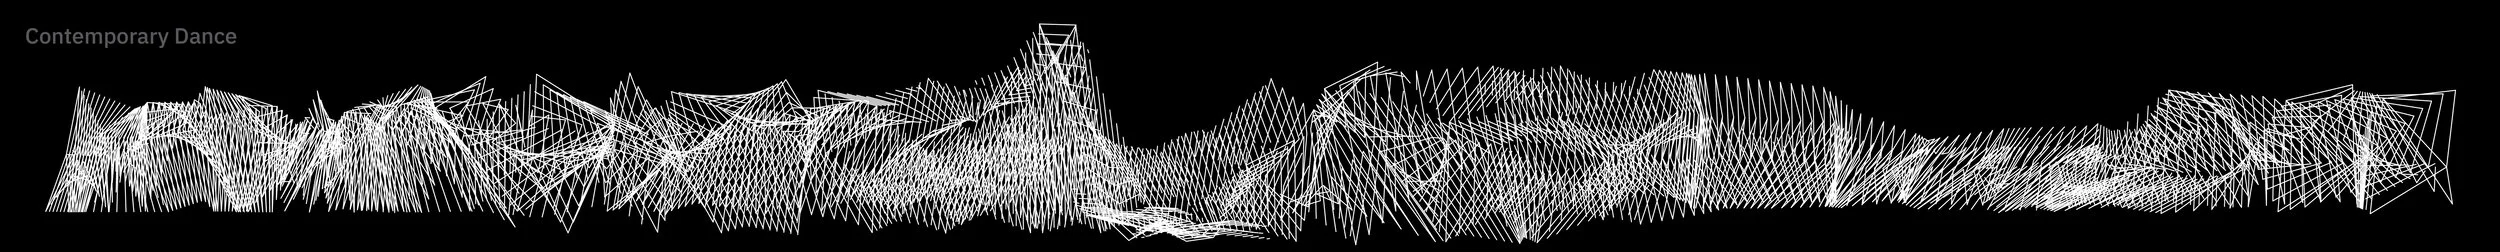
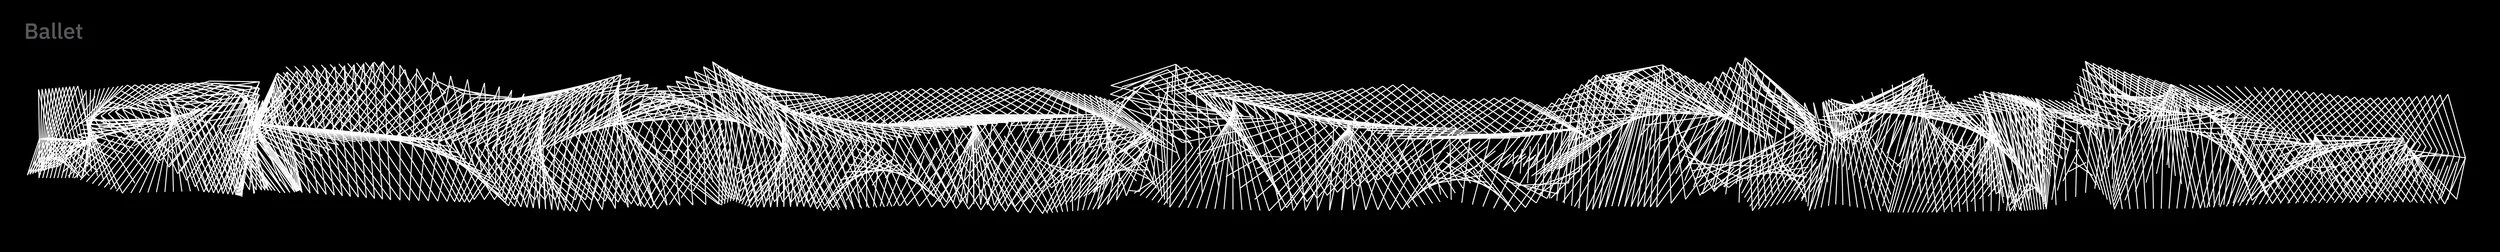
The visualization above adds the dimension of time, displaying the spatial relationships between the same points on the body over the course of the whole dance. I would’ve also liked to track the speed of the movement but we had no time.