CAl Poly Campus Network
Data Visualization, ArcGIS
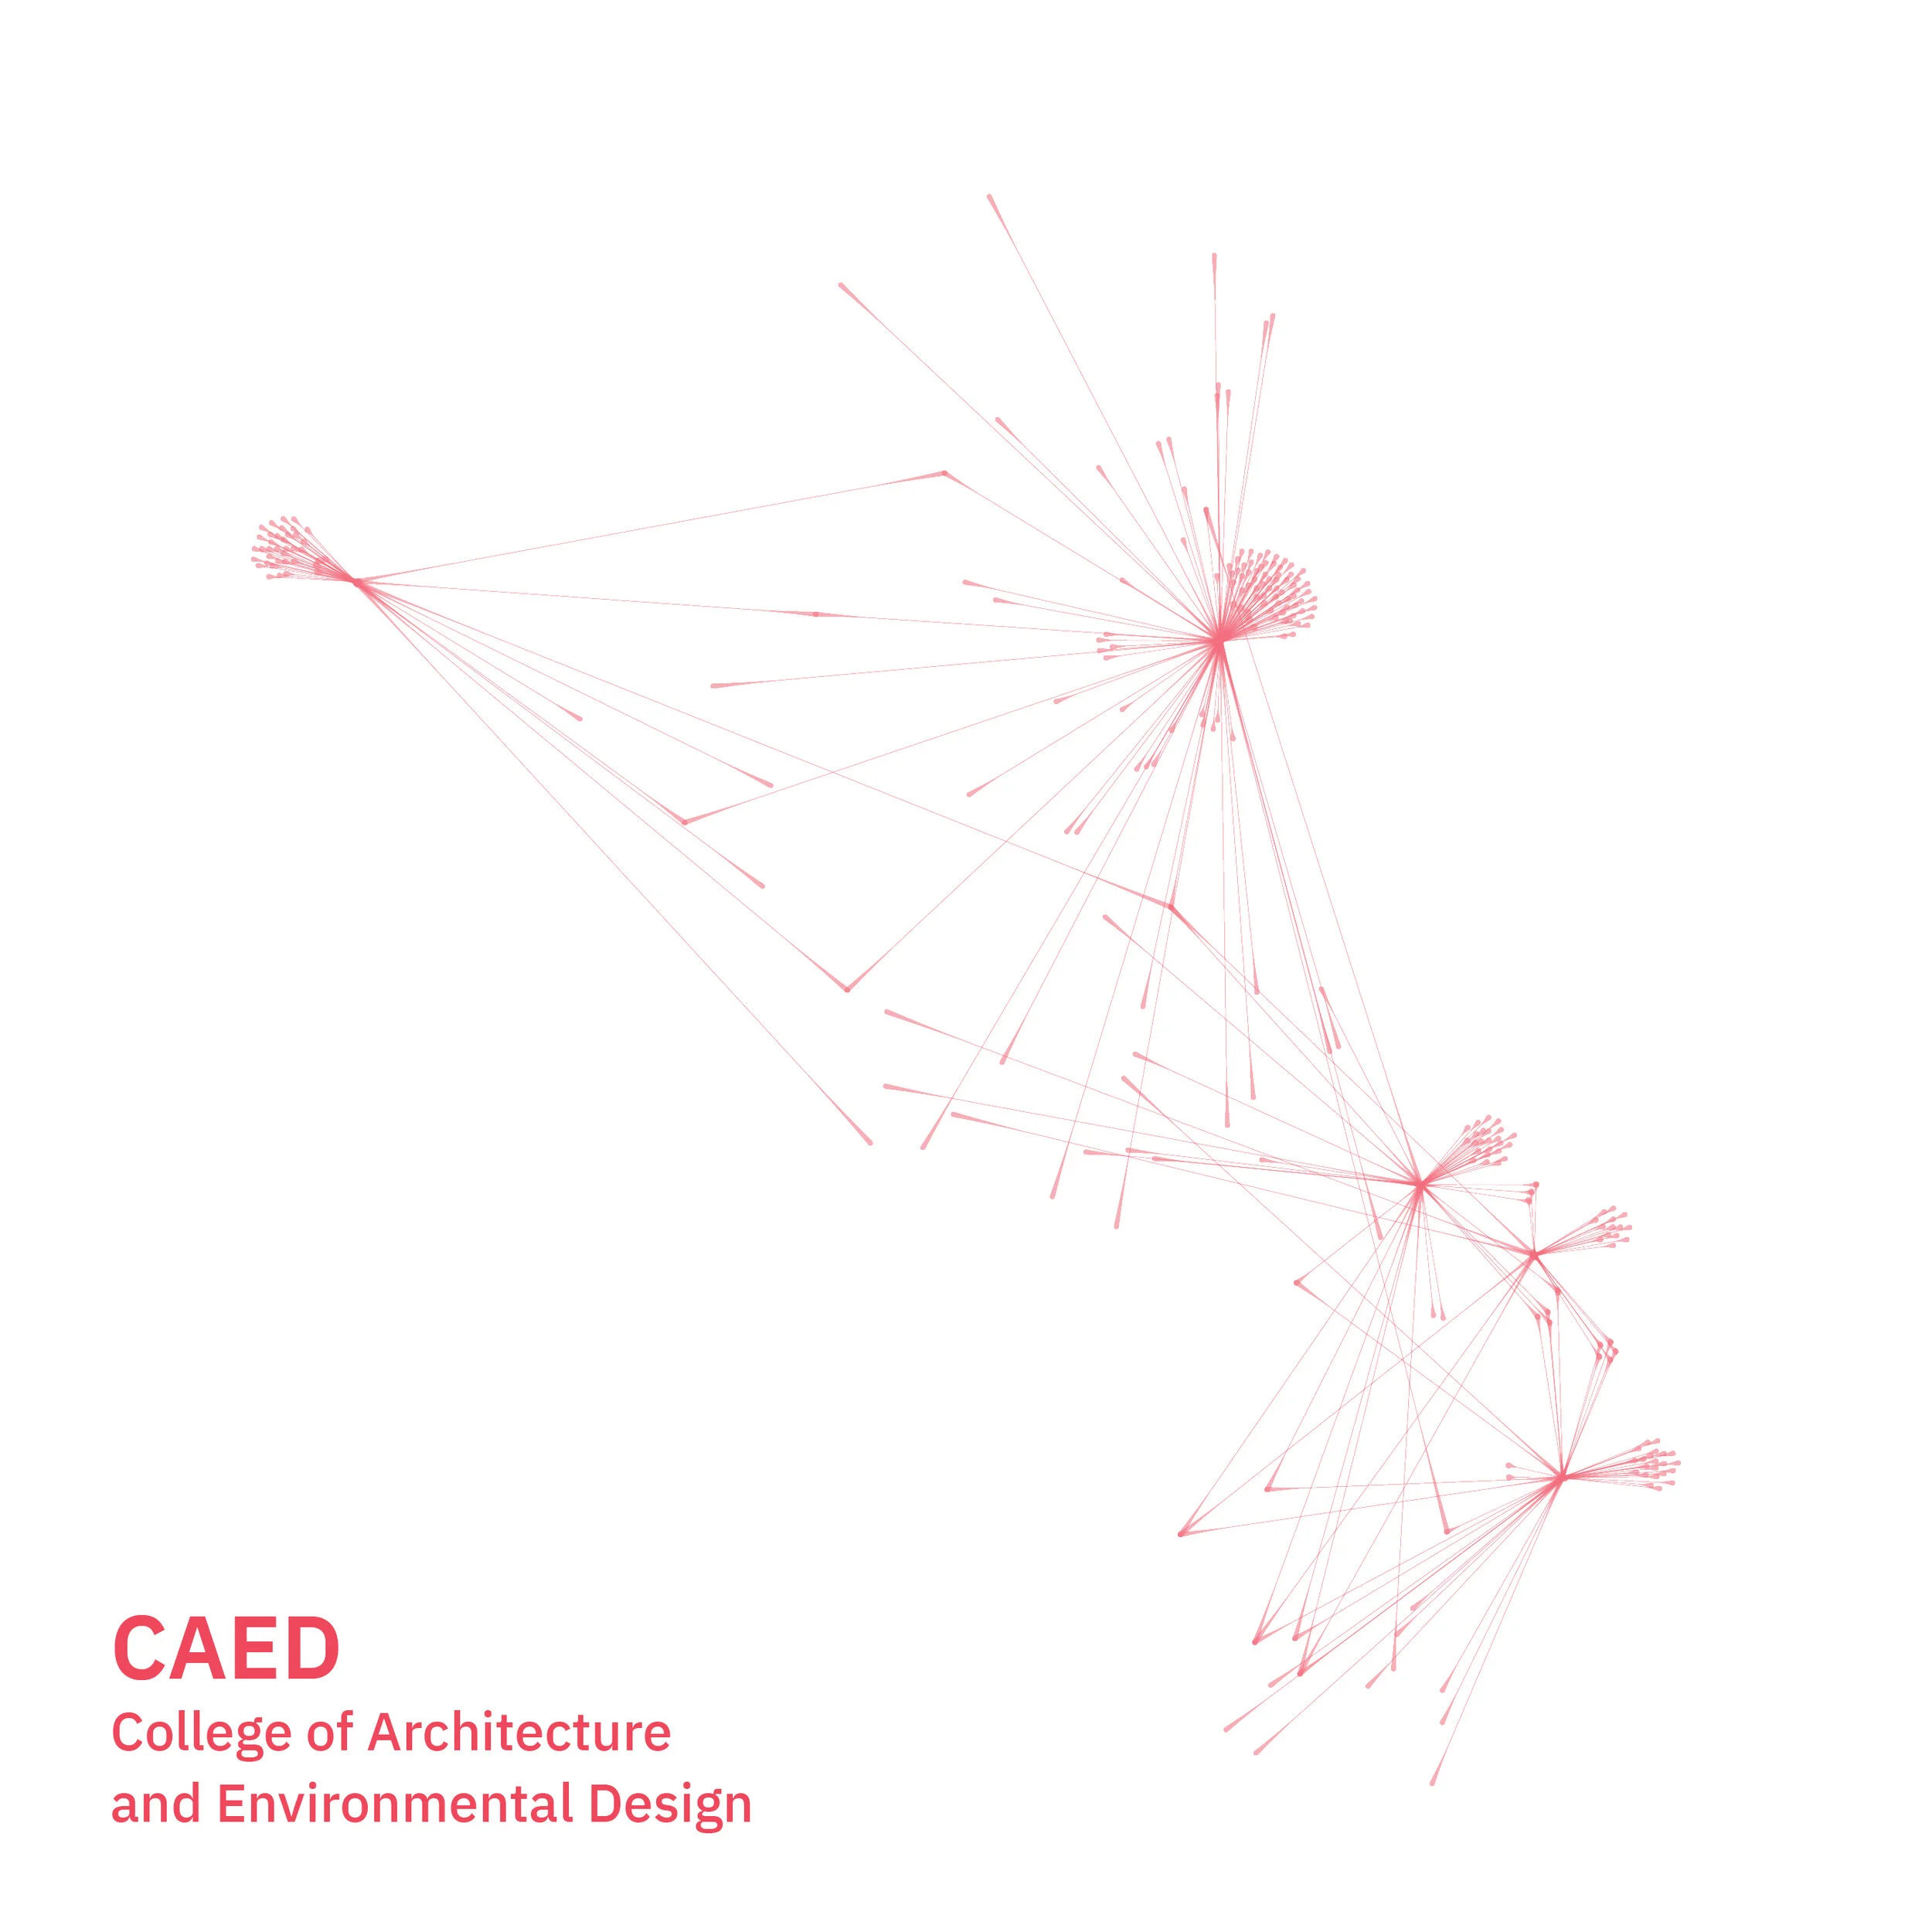
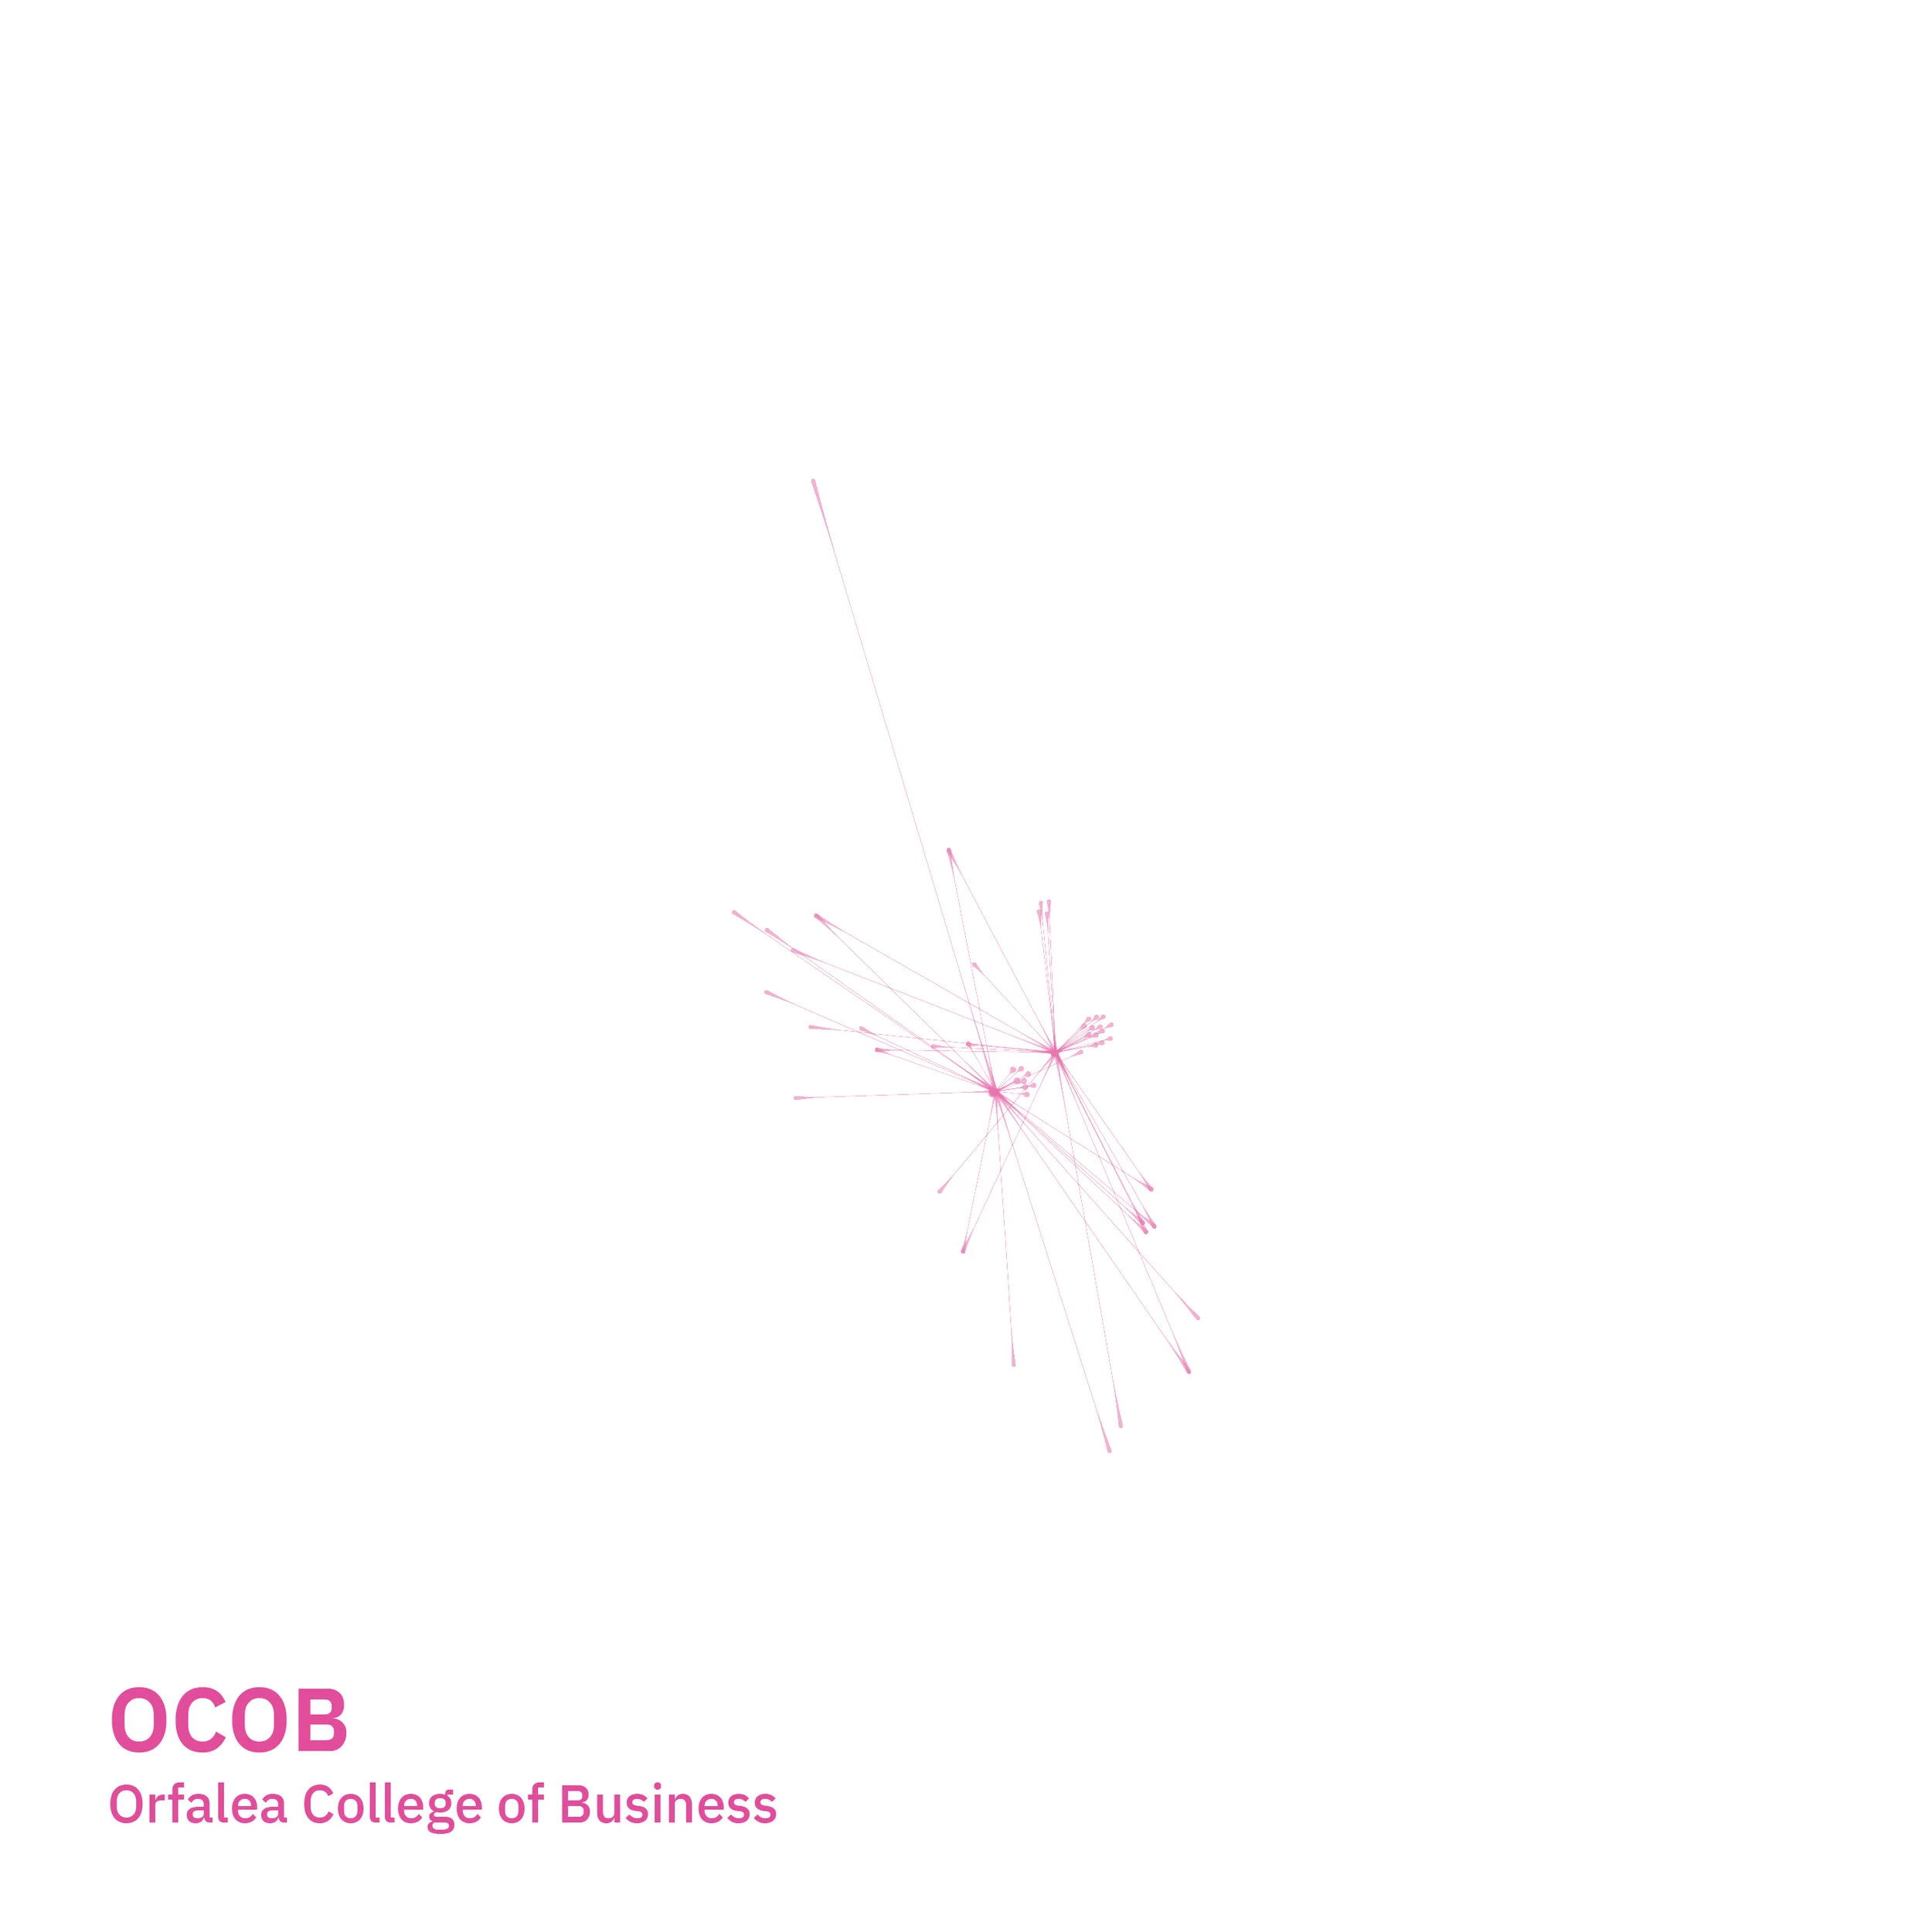
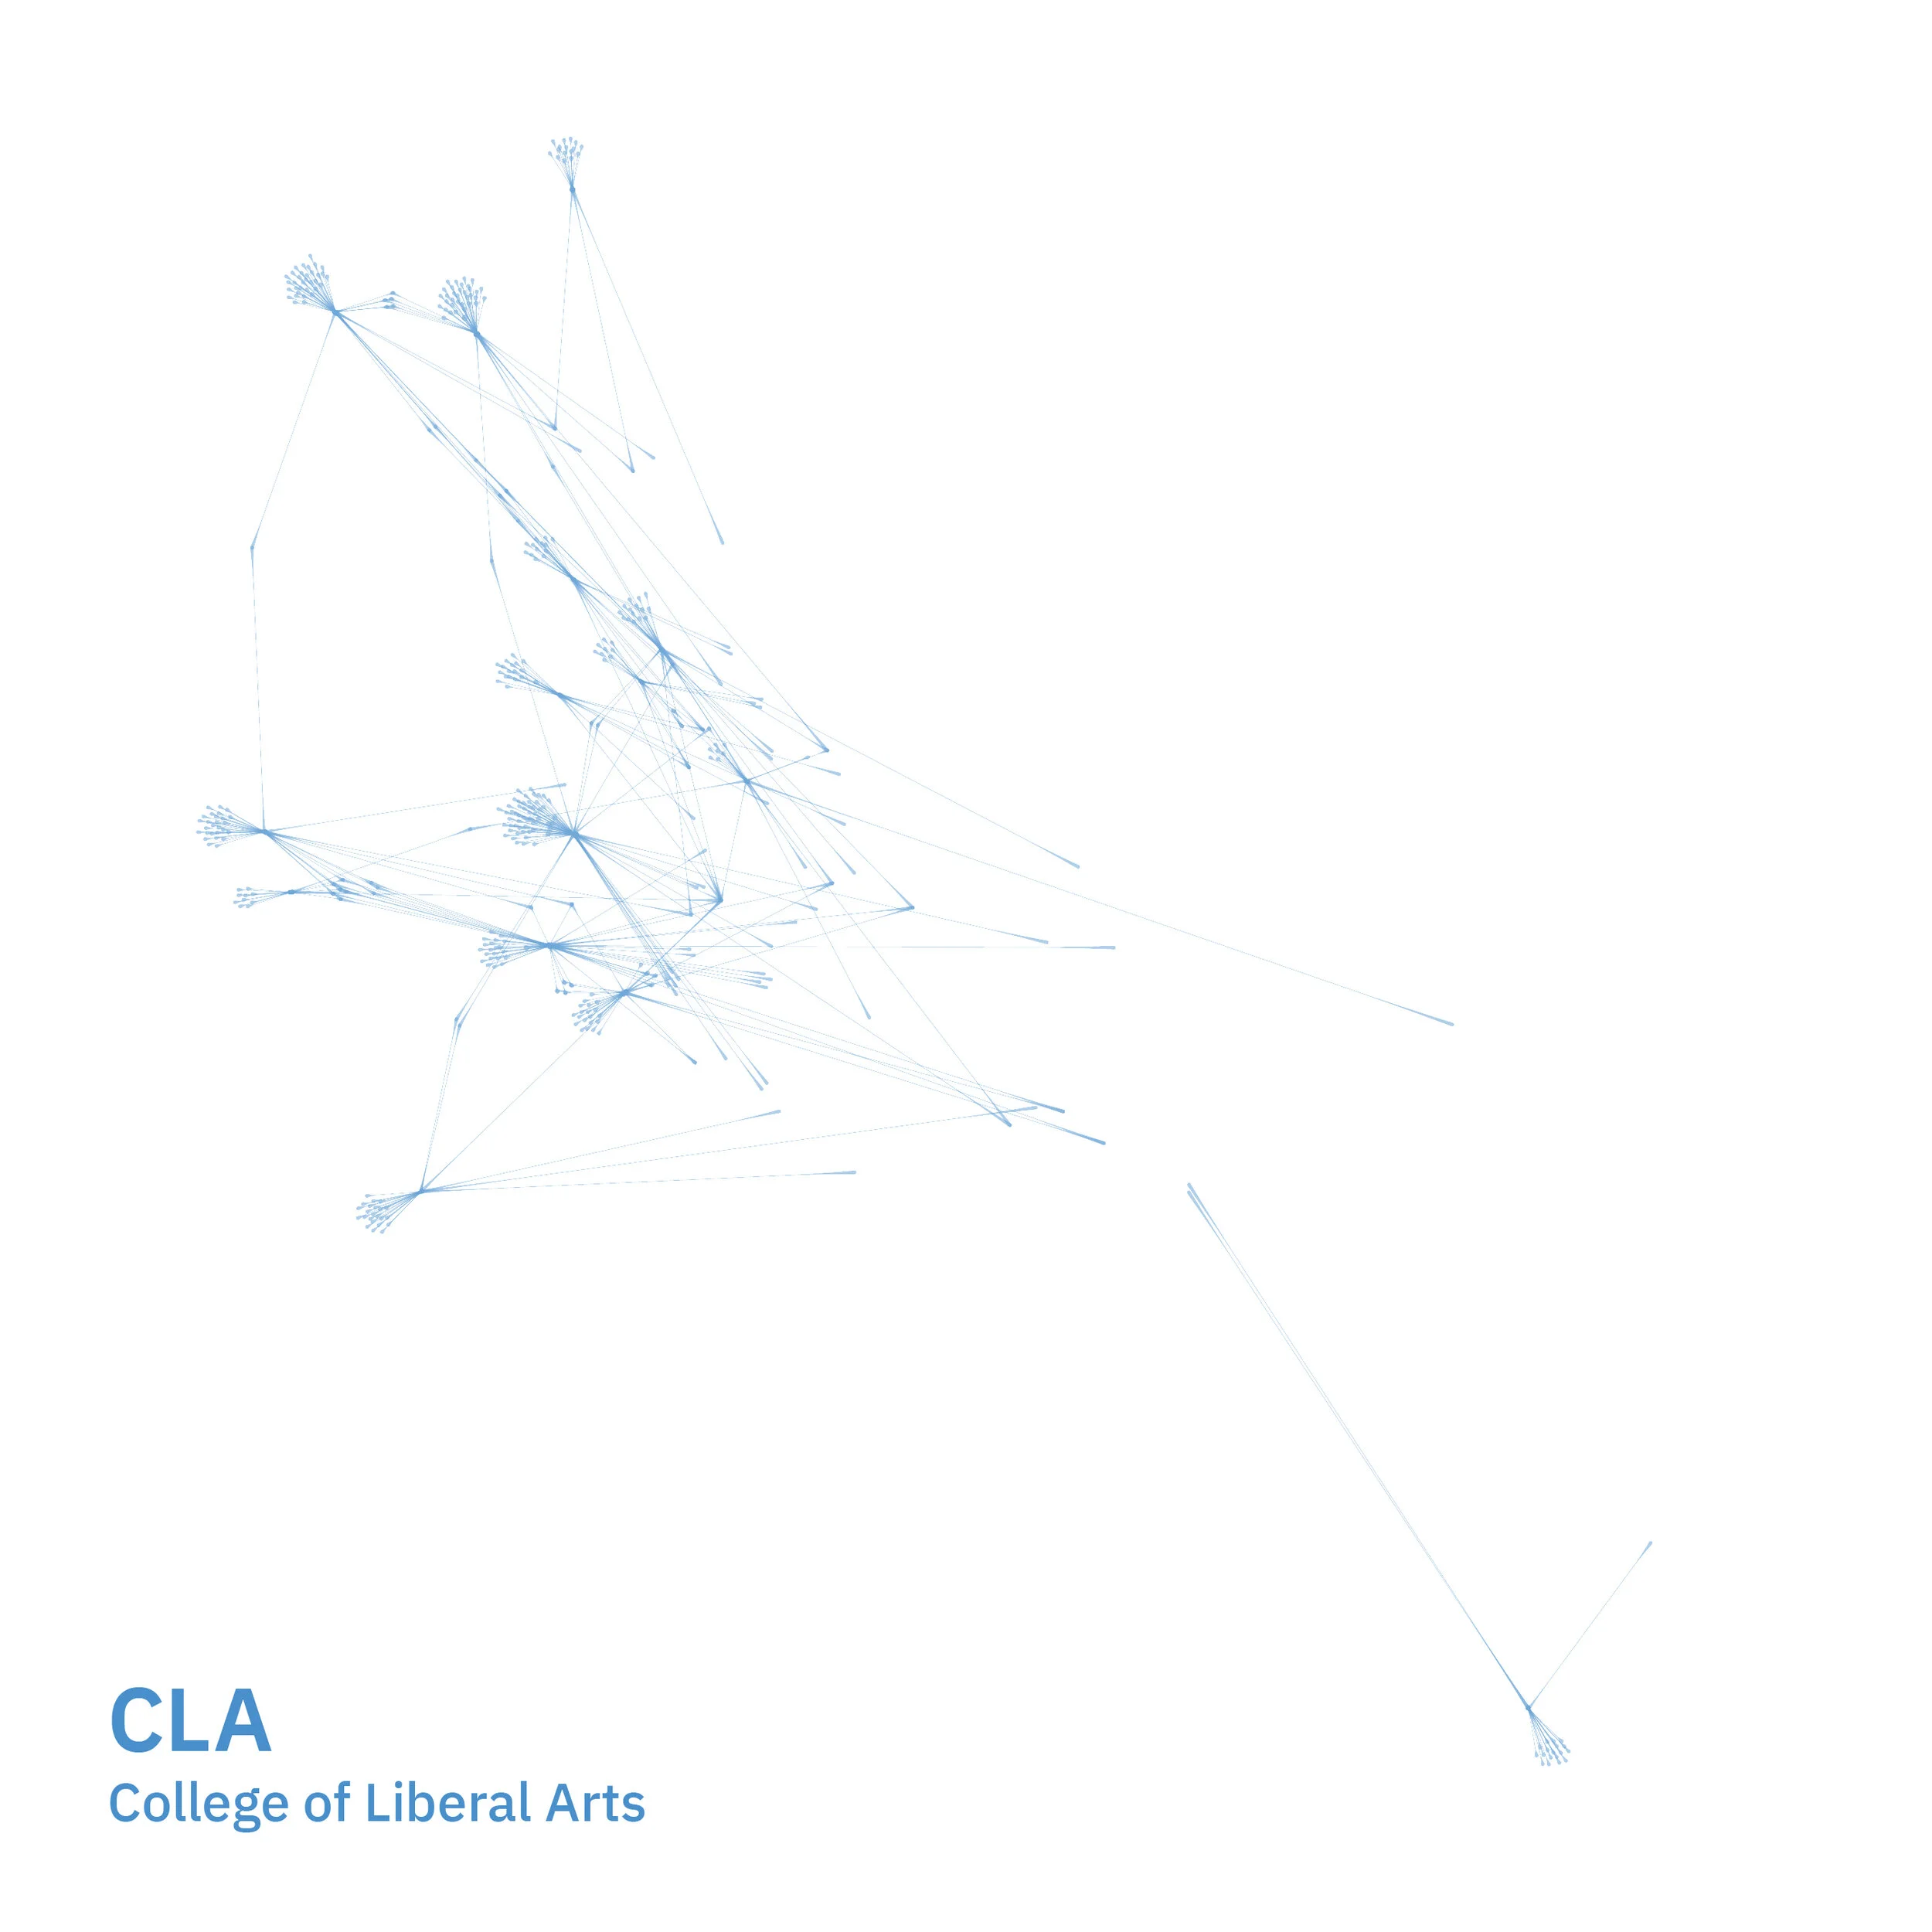
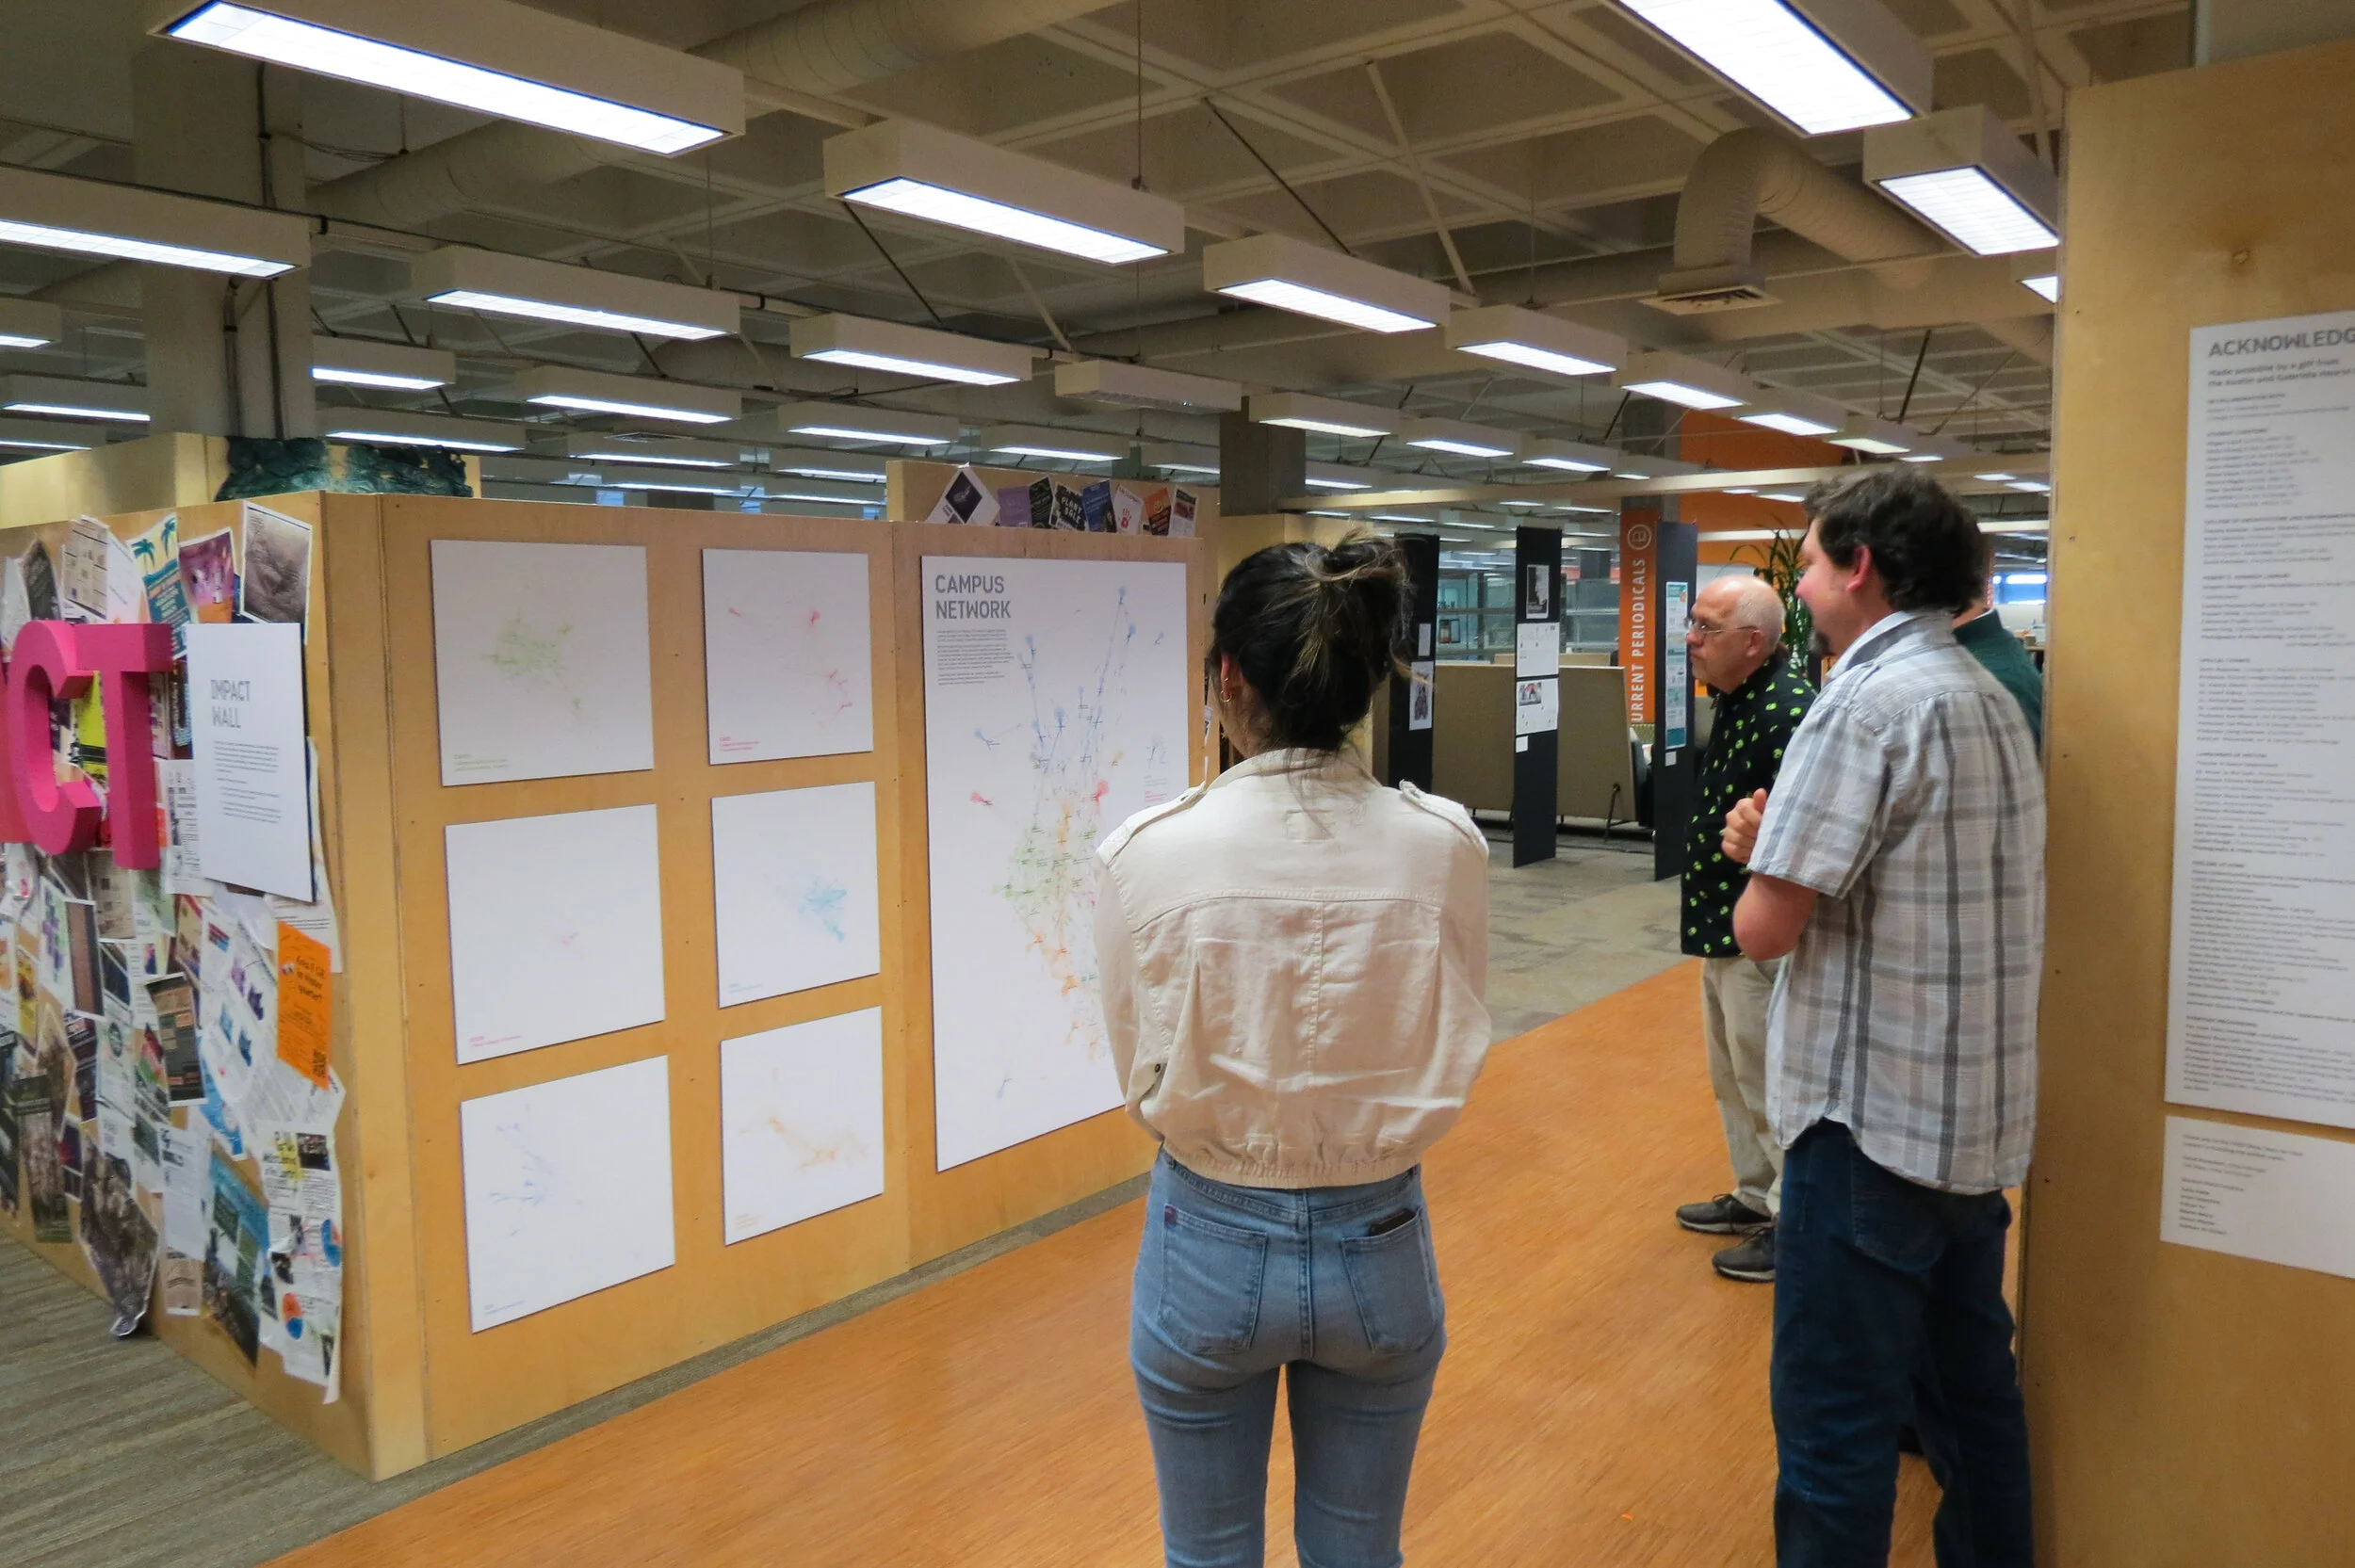
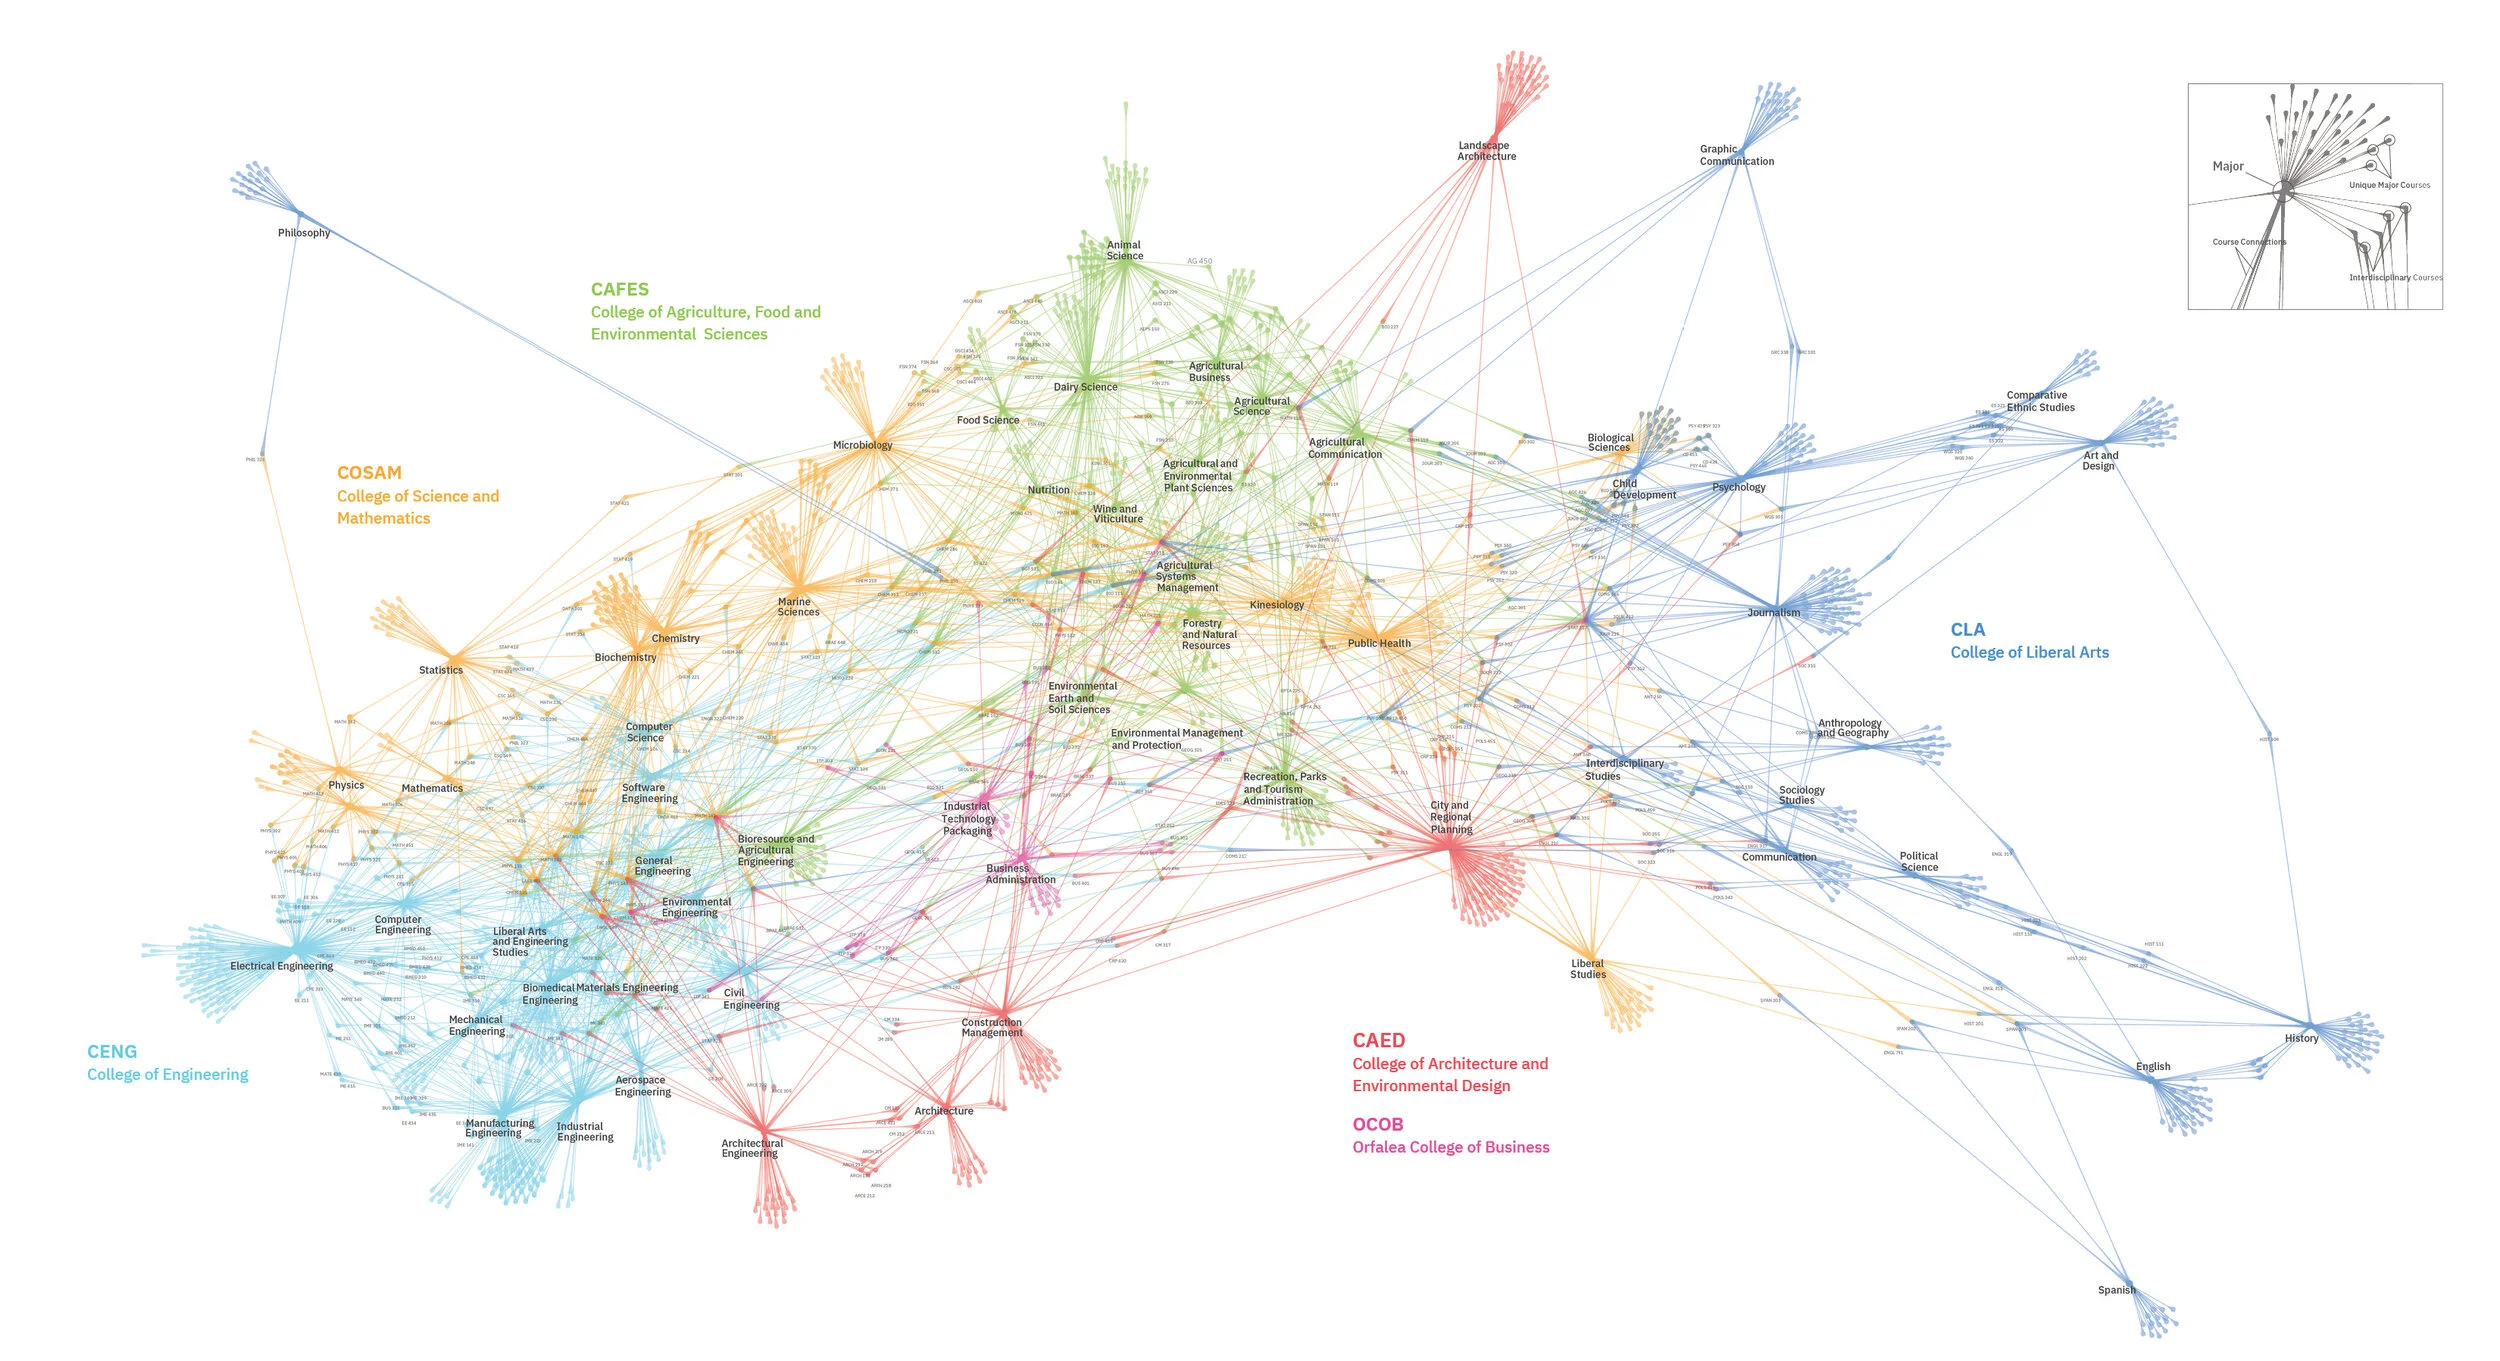
This visualization was created as a supplement to the Kennedy Library exhibit “Impact: the Visual Communication of Information”. I worked with Kennedy Library’s GIS Specialist Russell White and plotted the entire course catalog in ArcGIS. The visualization of all of that data created a web of interconnected courses and majors and revealed the network that makes up my alma mater.
Beyond illustrating the colleges, majors, and classes of Cal Poly, my goal was to emphasize and celebrate the interdisciplinary connections between colleges and majors. These classes are often the most memorable for Cal Poly students and are what make the campus a true network.
Horizontal network modified for “Impact” Catalog
Though I believe I created a sufficient comprehensive view of the course catalog, I wish I had the time to zero in on one or two specific student experiences. Focusing on how a couple students navigate through the network would have portrayed how the system normally works and revealed the human narratives behind each network connection.